This mathematics ClipArt gallery offers 13 images of the graphs of the six basic trigonometric functions: sine, cosine, tangent, cotangent, secant, and cosecant.

Illustration of one possible outcome (no triangle occurs) when discussing the ambiguous case using the Law of Sines. In this case, side a is less than the height (bsinα).

Ambiguous Case

Illustration of one possible outcome (no triangle occurs) when discussing the ambiguous case using the…
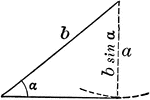
Illustration of one possible outcome (1 triangle occurs) when discussing the ambiguous case using the Law of Sines. In this case, side a is equal to the height (bsinα).

Ambiguous Case

Illustration of one possible outcome (1 triangle occurs) when discussing the ambiguous case using the…
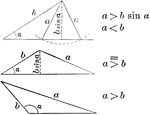
Illustration of one possible outcome (2 triangles occur) when discussing the ambiguous case using the Law of Sines. In this case, side a is greater than the height (bsinα).

Ambiguous Case

Illustration of one possible outcome (2 triangles occur) when discussing the ambiguous case using the…
Cosine curve plotted from negative pi to 2 pi. Graph of y=cos x.

Cosine Curve y=cos x

Cosine curve plotted from negative pi to 2 pi. Graph of y=cos x.

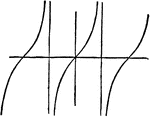
Illustration showing a tangent curve.

Tangent Curve

Illustration showing a tangent curve.

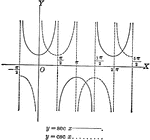
Secant and Cosecant curves plotted from negative pi to 2 pi. Graph of y=sec x and y=csc x.

Secant and Cosecant Curves, y=sec x and y=csc x

Secant and Cosecant curves plotted from negative pi to 2 pi. Graph of y=sec x and y=csc x.
Sine curve plotted from 0 to 2 pi. Graph of y=sin x.

Sine Curve y=sin x

Sine curve plotted from 0 to 2 pi. Graph of y=sin x.

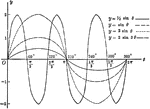
Sine curves of varying frequency and amplitude plotted from 0 to 2 pi. Graph of y= sin θ, y= 1/2 sin θ, y=2 sin θ, y= 2 sin 3θ

Sine Curves y= sin Ǝ, y= 1/2 sin Ǝ, y=2 sin Ǝ, y= 2 sin 3Ǝ

Sine curves of varying frequency and amplitude plotted from 0 to 2 pi. Graph of y= sin θ, y= 1/2…

Sine curves of varying frequency plotted from 0 to 2 pi. Graph of y= sin t, y= r sin1/2t, y=r sin 2t.

Sine Curves y= sin t, y= r sin1/2t, y= r sin 2t

Sine curves of varying frequency plotted from 0 to 2 pi. Graph of y= sin t, y= r sin1/2t, y=r sin 2t.

The curve of a sine wave.

Curves of sines

The curve of a sine wave.

Illustration two types of triangles that can be used to model the law of sines. "In a plane triangle any two sides are to each other as the sines of the opposite angles."

Law of Sines

Illustration two types of triangles that can be used to model the law of sines. "In a plane triangle…

"The curve of sines, in which the abscissas are proportional to an angle, and the ordinates to its sine." -Whitney, 1889

Sinusoid or Sine Wave

"The curve of sines, in which the abscissas are proportional to an angle, and the ordinates to its sine."…
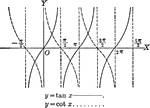
Tangent and Cotangent curves plotted from negative pi to 2 pi. Graph of y=tan x and y=cot x.

Tangent and Cotangent Curves, y=tan x and y=cot x

Tangent and Cotangent curves plotted from negative pi to 2 pi. Graph of y=tan x and y=cot x.