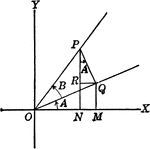
Angles used to illustrate the sum and difference of two angles and trig identities.

Angles Used to Illustrate Sum and Difference of Two Angles

Angles used to illustrate the sum and difference of two angles and trig identities.

Illustration of the projection of point P as it moves around a vertical circle of radius 3 in. in a counterclockwise direction. It start with the radius in a horizontal position and moves with an angular velocity of one revolution in 10 seconds.

Projection of Points in Circular Motion

Illustration of the projection of point P as it moves around a vertical circle of radius 3 in. in a…

Illustration of the projection of point P as it moves around a vertical circle of radius 2 ft. in a counterclockwise direction. It start with the radius in a horizontal position and moves with an angular velocity of one revolution in .5 seconds.

Projection of Points in Circular Motion

Illustration of the projection of point P as it moves around a vertical circle of radius 2 ft. in a…

Coordinate axis with angle XOP equal to theta, Θ, and angle XOQ=180 - Θ. From any point in the terminal side of XOP, as B, a perpendicular can be drawn, AB, to the x-axis; and from D, any point in the terminal side o f XOQ, perpendicular CD can be drawn to the x-axis. The right triangles OAB and OCD are similar. Also, OA, AB, OB, CD, and OD are positive, while OC is negative.

Coordinate Axis With Angles, Lines, and Perpendiculars Drawn

Coordinate axis with angle XOP equal to theta, Θ, and angle XOQ=180 - Θ. From any point in the terminal…
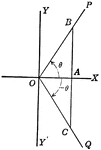
Angle XOP=Θ and angle XOQ=- Θ. From a point in the terminal side of each a perpendicular line is drawn to the x-axis. The right triangles OAB and OAC thus formed are similar, and have all their sides positive except AC, which is negative.

Coordinate Axis With Perpendiculars Drawn To Form Similar Right Triangles From Positive and Negative Theta, Θ

Angle XOP=Θ and angle XOQ=- Θ. From a point in the terminal side of each a perpendicular line is drawn…
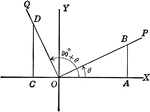
Angle XOP=Θ and angle XOQ=90+Θ. From a point in the terminal side of each a perpendicular line is drawn to the x-axis. The right triangles AOB and OCD thus formed are similar, and have all their sides positive except OC

Coordinate Axis With Perpendiculars Drawn To Form Similar Right Triangles

Angle XOP=Θ and angle XOQ=90+Θ. From a point in the terminal side of each a perpendicular line is…
Cosine curve plotted from negative pi to 2 pi. Graph of y=cos x.

Cosine Curve y=cos x

Cosine curve plotted from negative pi to 2 pi. Graph of y=cos x.

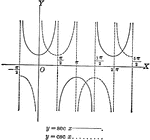
Secant and Cosecant curves plotted from negative pi to 2 pi. Graph of y=sec x and y=csc x.

Secant and Cosecant Curves, y=sec x and y=csc x

Secant and Cosecant curves plotted from negative pi to 2 pi. Graph of y=sec x and y=csc x.
Sine curve plotted from 0 to 2 pi. Graph of y=sin x.

Sine Curve y=sin x

Sine curve plotted from 0 to 2 pi. Graph of y=sin x.

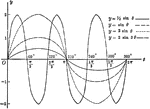
Sine curves of varying frequency and amplitude plotted from 0 to 2 pi. Graph of y= sin θ, y= 1/2 sin θ, y=2 sin θ, y= 2 sin 3θ

Sine Curves y= sin Ǝ, y= 1/2 sin Ǝ, y=2 sin Ǝ, y= 2 sin 3Ǝ

Sine curves of varying frequency and amplitude plotted from 0 to 2 pi. Graph of y= sin θ, y= 1/2…

Sine curves of varying frequency plotted from 0 to 2 pi. Graph of y= sin t, y= r sin1/2t, y=r sin 2t.
Sine Curves y= sin t, y= r sin1/2t, y= r sin 2t

Sine curves of varying frequency plotted from 0 to 2 pi. Graph of y= sin t, y= r sin1/2t, y=r sin 2t.

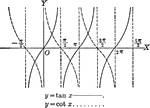
Tangent and Cotangent curves plotted from negative pi to 2 pi. Graph of y=tan x and y=cot x.

Tangent and Cotangent Curves, y=tan x and y=cot x

Tangent and Cotangent curves plotted from negative pi to 2 pi. Graph of y=tan x and y=cot x.
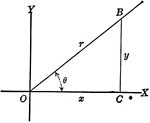
Right triangle OCB that can be used to show the relationships between x, y, r, and Θ.

Right Triangle OCB With, x, y, and r shown

Right triangle OCB that can be used to show the relationships between x, y, r, and Θ.