| Maps > United States > Meteorology |
 |
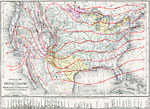
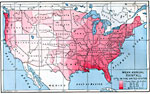
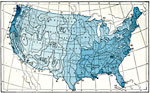
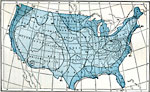
Mean Annual Rainfall of the United States, 1910 Map showing mean annual rainfall of the United States in 1910. |
 |
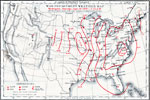
United States Weather Map on a Winter's Day, 1910 A weather map of the United States on a winter's day. The lines are lines of equal air pressure, the lower the figure the lighter the air. The pressure is determined by an instrument called the barometer. |
 |
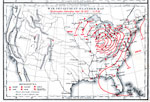
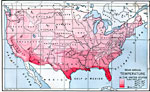
Isothermal chart of the United States for January, 1910 Isothermal chart of the United States for January. |
 |
Isothermal chart of the United States for July, 1910 Isothermal chart of the United States for July. |
 |
Normal Surface Temperatures for July, 1911 A map showing the normal surface temperatures for the month of July in the United States. |
 |
Normal Surface Temperature for January, 1911 A map showing the normal surface temperatures for January in the United States. |
 |
Killing Frost, 1911 A map of the average date of the last killing frost in Autumn. |
 |
First Killing Frost of Spring, 1911 A map showing the average dates of first killing frost in Spring. |
 |
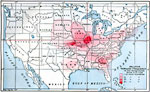
Mean Annual Precipitation in the United States, 1911 A map showing the mean annual precipitation in the United STates reduced to inches of rainfall. |
 |
Absolute Minimum Temperatures, 1911 A map showing the absolute minimum temperatures in the United States. |
 |
Average Humidity, 1911 A map showing the average annual humidity of the air in the United States. |
 |
Rainfall Percentage, 1911 A map showing the percentage of annual rainfall received in the six warmer months, April to September inclusive. |
 |
Average Temperature in January, 1906 A map showing the average surface temperatures in the United States during the month of January. |
 |
Average Temperature in July, 1906 A map showing the average surface temperatures in the United States during the month of July. |
 |
War Department Weather Map, September 28, 1872 War department weather map from Washington, on Saturday, September 28, 1872, at 7:35 a.m. |
 |
War Department Weather Map, September 28, 1872 her map from Washington, on Saturday, September 28, 1872, at 11 p.m. |
 |
Mountains, Plains, Rivers, Isothermal Lines of the United States, 1873 United States map consisting of mountains, plains, rivers, and isothermal lines. |
 |
Path of a Hurricane, September 12-14, 1878 This hurricane struck South Carolina on September 12, 1878 and caused at least 9 deaths before becoming extra-tropical on September 13 over Virginia. |
 |
High Pressure Center, January 16, 1882 A high pressure area centered over the Dakotas and Montana observed January 16, 1882. |
 |
Relative Tornado Frequency in the United States, 1888 Shows average tornado frequencies for regions of the United States. |
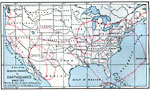 |
Earthquake Activity, Since 1872 A few of the regions shaken by earthquakes since 1872. Month and year of each earthquake in indicated in its boundary line. — Eclectic Physical Geography, 1888 |
 |
November Weather Map of Eastern United States, 1888 Shows a cyclone, low pressure system, in Iowa as well as isobar and isotherm readings and wind directions. It also shows rainfall, snow, and cloud coverage. |
 |
Mean Annual Rainfall in the United States, 1888 Mean annual rainfall in the United States. — Eclectic Physical Geography, 1888 |
 |
Mean Annual Temperature in the United States, 1888 Mean annual temperatures in the United States. — Eclectic Physical Geography, 1888 |
 |
Low pressure system, February 4, 1889 A low pressure system centered over Minnesota on Feb. 4, 1889. |
 |
Weather Chart, March 27, 1890 The condition of the atmosphere during a tornado in Kentucky on March 27, 1890. |
 |
Physical Map of the United States showing the Surface Structure and Isothermal Lines, 1891 Map of the United States showing the Surface Structure and Isothermal Lines. |
 |
Weather Map, showing condition of the Weather on a certain day in April, 1891 Weather map of the United States showing the showing condition of the Weather on a certain day in April. |
 |
Map showing condition of the Weather on the following day, 1891 Weather map of the United States showing the showing condition of the Weather on the following day in April. |
 |
Precipitation Chart, March 1, 1891 to September 25, 1891 "The seasonal conditions of rainfall from March 1 to September 25 throughout the United States, or during the growing period of the present year. From this chart it will be seen that more than the usual amount of rain occurred from the Indian Territory and northern Texas northward over the west slope of the Missouri Valley, including the west half of South Dakota and the greater portions of North Dakota. This region of excessive rain extends to the Pacific coast, over Oregon and the greater portion of Washington. Within the limit of the shaded portion of the chart light lines indicating areas over which the rainfall ranged from 2 to 6 inches in excess of the usual amount, and the time of the occurrence of this rainfall, will be found in the weekly record of the stations, as given in the tabular statement. Small areas of excessive rainfall occurred over the eastern portion of the United States, as shown on the charts, while throughout the central valleys, including the greater portion of the cotton, corn, and wheat regions, the rainfall was less than usual. While the deficiency was slight and ranged only from 2 to 6 inches below the average of previous years in the corn and wheat States of the central valleys and in the northern portion of the cotton region, there was a marked deficiency in the lower Mississippi Valley along the Gulf coast, where the rainfall was 8 to 20 inches less than usual, the region of greatest drought including the sugar and rice regions of Louisiana. On the Pacific coast, the rainfall was generally in excess in Oregon and Washington, while over the greater portion of California it was from 1 to 2 inches less than usual." (— Report of the Secretary of Agriculture, 1891) |
 |
Tempurature Departures, March 1, 1891 to September 25, 1891 "Plate VI exhibits the thermal conditions of the season as compared with the average of previous years, the shaded portions showing that in New England, over the lake region, and along the Pacific coast it was slightly warmer than usual, while throughout all principal agricultural districts the average daily temperature for the entire period was from 1 to 3 below the average."(— Report of the Secretary of Agriculture, 1891) |
 |
Track of a Cyclone, 1893 A map showing the northward progression of a tropical cycline in August of 1893. |
 |
Paths of Cyclonic Areas, January 1893 Paths pursued by the centers of cyclonic areas in January, 1893. |
 |
Paths of Anticylonic Areas, January 1893 Paths pursued by the centers of anticyclonic areas in January, 1893. |
 |
Paths of Cyclonic Areas, July 1893 Paths pursued by the centers of cyclonic areas in July, 1893. |
 |
Paths of Anticyclonic Areas, July 1893 Paths pursued by the centers of anticyclonic areas in July, 1893. |
 |
United States Weather, August 20, 1893 United States weather map for 8 P.M., August 20, 1893. |
 |
Midsummer Cloudiness, 1896 Average cloudiness in midsummer, August. (Scale: 0=clear; 100=completely cloudy.) |
 |
Wind Velocities, 1896 Average wind velocities for the year (in miles per hour). |
 |
Air Pressure and Wind Direction, January 1896 Normal air pressure at sea level, and normal wind direction, for January. |
 |
Air Pressure and Wind Direction, July 1896 Normal air pressure at sea level, and normal wind direction, for July. |
 |
Hour of Maximum Wind, July 1896 The hour of maximum wind in the United States, for July. |
 |
Rain Wind Direction, 1896 Wind direction most likely to be followed by rain. |
 |
Thunderstorms, 1896 Months of maximum frequency, and average annual number, of thunderstorms. |
 |
Barometric Pressure and Weather, 1896 Weather conditions for average areas of high and low barometric pressure. |
 |
United States Weather, December 24, 1893 United States weather map for 8 P.M., December 24, 1893. |
 |
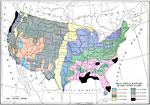
United States Climactic Subdivisions, 1896 The main climactic subdivisions of the United States, adopted by the U.S. Weather Bureau. |
 |
Average Temperature, January 1896 Average temperatures for January in the United States. |
 |
Average Temperature, July 1896 Average temperature for July in the United States. |
 |
Shade Temperature Oscillation, 1896 Absolute amplitude of oscillation of shade temperature in the United States. |
 |
Days Below Freezing, 1896 Number of days with average temperature below freezing in the United States. |
 |
Temperature Variability, 1896 Variability of average daily temperature in January in the United States. |
 |
Drastic Temperature Drops, 1896 Relative frequency of falls of temperature of over 20 degrees in 24 hours. |
 |
Earliest Hard Frost, 1896 Average date of earliest hard frost in the United States. |
 |
Latest Hard Frost, 1896 Average date of latest hard frost in the United States. |
 |
Annual Rainfall, 1896 Average annual rainfall in the United States, in inches. |
 |
Rainfall in Rainy Season, 1896 Percentage of total rainfall in the rainy season and months of rainy season. |
 |
Heaviest Rainfalls, 1896 Heaviest daily rainfalls. |
 |
Annual Snowfall, 1896 Average annual snowfall in the United States (depth in inches). |
 |
Days with Precipitation, 1896 Average number of days during the year with precipitation. |
 |
Consecutive Days with Precipitation, 1896 Greatest number of consecutive days with precipitation. |
 |
Drought, 1896 Greatest number of days without precipitation (drought). |
 |
Midwinter Humidity, January 1896 Average absolute humidity in midwinter, January. |
 |
Midsummer Humidity, July 1896 Average absolute humidity in midsummer, July. |
 |
Relative Humidity, 1896 Average annual relative humidity in the United States. |
 |
Midwinter Cloudiness, 1896 Average cloudiness in midwinter, January. (Scale: 0=clear; 100=completely cloudy.) |
 |
Heat Belts in the United States, 1898 AD Map of heat belts in North America, 1898 AD. "The north temperate heat belt travels northward in summer and southward in winterÉIn summer it [the heat belt] is so far north that its southern edge occupies the position represented by the dotted line in theÉchartÉAll the country south of this line is in the hot belt at that season. In winter, however, the edge of the hot belt is in Mexico, and the temperate belt covers only the southern part of the United States, while all the country north of the heavy line in the chart is in the cold belt." —Redway, 1898. |
 |
Number of Freezing Days in the United States, 1898 AD Map of the number of freezing days [per year] in North America, 1898. "The number of freezing days in a year increases northwardly over the shaded portion of the chart, the first line showing where there are thirty days of freezing weather, the second line sixty days, and so on." —Redway, 1898. |
 |
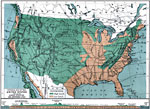
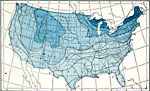
Rainfall in the United States, 1898 AD Map of rainfall in North America, 1898. "The regions shaded by lines would each year be covered more than twenty inches deep by the rainfall, if the water remained where it fell. This amount is ample for almost all kinds of farming. In the parts of the United States shown by dots, or left unshaded, the rainfall is less than twenty inches and is too little for successful farming, except in some parts of the north where the rains occur during the few weeks when the growing crops need most moisture. As a rule, however, irrigation is necessary for farming in these regions of light rainfall." —Redway, 1898. |
 |
A Cyclone in the United States, 1898 AD A cyclone in North America. "The effect of a cyclonic storm upon the weather is illustrated by the chartÉThe point of the heavy arrow lies in a storm center, around and into which the winds are whirling, as shown by the light arrows. To the east of the center the winds come from the south and southeast and make the weather warmÉ[on the western side of the storm the winds come from the north] these winds bring cool or cold weather to that regionÉThe storm center is moving all the timeÉthus, as the storm drifts rapidly eastward over the country, it pushes warmer weather along in front of it, and drags colder weather along in its rear. |
 |
Mean Annual Rainfall in Inches, 1899 Map of the United States' Mean Annual Rainfall in inches. Coded to show rainfall amounts of various regions. |
 |
Maximum Rainfall, 1899 Map of the United States' Mean Annual Rainfall in inches. Coded to show rainfall amounts of various regions. |
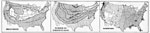 |
United States Climate, 1901 Heat belts, number of freezing days, and rainfall in the United States. |
 |
Cyclone, 1901 Map showing winds in a cyclone over the United States. |
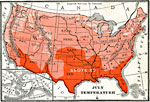 |
Temperatures in the United States, July 1906 July temperature ranges in the United States. |
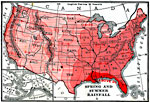 |
Spring and Summer Rainfall in the United States, 1906 Rainfall ranges in the United States during the spring and summer. |
 |
Weather Map, Tuesday November 16, 1909 A weather map from Tuesday, November 16, 1909. |
 |
Weather Map, Wednesday November 17, 1909 A weather map for November 17, 1909. |
 |
Mean Annual Rainfall of the United States, 1910 A map showing the mean annual rainfall in the United States around 1910. |
 |
Winter Weather Map of the United States, 1910 A weather map of the United States on a winter's day. The lines are lines of equal air pressure, the lower the figure, the lighter the air. The pressure is determined by an instrument called the barometer. |
 |
Weather Map of the United States, 1910 A weather map of the United States on a winter day. |
 |
Isothermal Chart of the US for January, 1910 An isothermal chart of the United States for January. |
 |
Isothermal chart of the US for July, 1910 An isothermal chart of the United States for July. |
 |
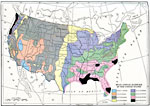
Precipitation in the Texas Region, 1911 A map showing the precipitation in the Texas Region. I, over 50 inches; II, over 45; III, over 40; IV, over 35; V, over 30; VI, over 25; VII, over 20; VIII, over 15; IX, over 10. |
 |
Average Annual Rainfall, 1916 A 1916 map showing the average annual rainfall in the United States. |
 |
Rainfall in the United states, 1921 Untitled map of North America shows areas where there is plenty of rain for successful farming. |
 |
United States Annual Rainfall in inches, 1921 This is a map of the United States showing the annual rainfall in inches. It reveals the rainfall level by shading from blank which is 0 to 10 inches to heavily shaded which is over 60 inches. |
 |
United States Weather Map, 1921 This is a map showing the United States weather (circa 1921). It shows wind direction, climate and thunderstorms all over the country. It also shows pressure by stating low or high. |
| Maps > United States > Meteorology |
Maps is a part of the Educational Technology Clearinghouse
Produced by the Florida Center for Instructional Technology © 2007
College of Education, University of South Florida