Maps Site map
  Maps > United States > Agriculture
Site Map  

  Record   111   to   120  of   141

A collection of agricultural production and agricultural related maps in the United States for use in the K-12 classroom.

Milk Sold from Farms, 1919
A map of the United States from the U. S. Department of Agriculture (1922) showing the number of gallons of milk sold from farms in 1919 by state. "The amount of milk sold from farms, as in 1899 and 1909, is concentrated north of the Ohio and ea...

Value of Dairy Products, 1919
A map of the United States from the U. S. Department of Agriculture (1922) showing the dollar value of dairy products in 1919 by state. "This map presents a striking contrast to the map for 1839. The value of the dairy products of the Rocky Moun...

Butter Made on Farms, 1919
A map of the United States from the U. S. Department of Agriculture (1922) showing butter production on farms by state in 1919....

Receipts from the Sale of Dairy Products, 1919
A map of the United States from the U. S. Department of Agriculture (1922) showing the receipts from the sale of dairy products in 1919 by state....

Average Milk Production per Dairy Cow, 1919
A map of the United States from the U. S. Department of Agriculture (1922) showing the average production (in pounds) of milk per cow over the course of a year in 1919. The map is keyed to show production per cow per state ranging from below 2,000 po...

Legnuminous Hay Production, 1919
A map of the United States from the U. S. Department of Agriculture (1922) showing leguminous hay production in 1919. "Leguminous hays are splendid feed for dairy animals, and where they can be grown successfully are replacing other hays. West o...

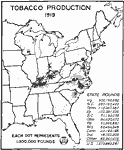
Tobacco Production, 1919
A map of the United States from the U. S. Department of Agriculture (1922) showing centers of production of tobacco in the United States in 1919....

Tobacco Acreage by Type, 1919
A map of the eastern United States from the U. S. Department of Agriculture (1922) showing tobacco acreage subdivided by the type of tobacco raised and principal methods of curing the product in 1919. Each dot represents 5,000 acres in cultivation....

Oat Production in the US, 1919
A map of the United States from the U. S. Department of Agriculture (1922) showing oat production in 1919, given in bushels. Each dot represents 200,000 bushels. The total yield of oats for the United States in 1919 was 1,055,182,798 bushels....

Barley Production in the US, 1919
A map of the United States from the U. S. Department of Agriculture (1922) showing the average yield of barley production in 1919. Each dot represents 100,000 bushels. The total yield of barley for the United States in 1919 was 122,024,773 bushels....

First Previous Next Last


  Maps > United States > Agriculture
Site Map  

Maps ETC is a part of the Educational Technology Clearinghouse
Produced by the Florida Center for Instructional Technology © 2009
College of Education, University of South Florida