Maps Site map
  Maps > United States > Agriculture
Site Map  

  Record   21   to   30  of   141

A collection of agricultural production and agricultural related maps in the United States for use in the K-12 classroom.

Milk Sold from Farms, 1869
A map of the United States from the U. S. Department of Agriculture (1923) showing the number of gallons of milk sold from farms in 1869 by state. "Probably the greater part of the milk sold from farms in 1869 was whole milk for cities. Some of ...

Cheese Made on Farms, 1869
A map of the United States from the U. S. Department of Agriculture (1922) showing the distribution of cheese made on farms by state in 1869. "The farm production of cheese in 1869 was only half that of 1859. Cheese production had increased, but...

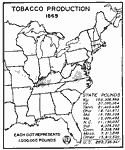
Tobacco Production, 1869
A map of the eastern United States from the U. S. Department of Agriculture (1922) showing tobacco producing areas and crop yield in 1869. Each dot represents 1,000,000 pounds of product. The total yield of tobacco for the United States in 1869 was 2...

Barley Production in the US, 1869
A map of the United States from the U. S. Department of Agriculture (1922) showing the average yield of barley production in 1869. Each dot represents 100,000 bushels. The total yield of barley for the United States in 1869 was 29,761,305 bushels....

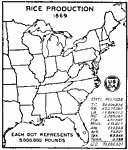
Rice Production in the United States, 1869
A map of the eastern United States from the U. S. Department of Agriculture (1922) showing the average yield of rice production in 1869. Each dot represents 5,000,000 pounds. The total yield of rice for the United States in 1869 was 73,635,021 pounds...

Average Yield of Oats per Acre in the US, 1869–1919
A map of the United States from the U. S. Department of Agriculture (1922) showing the average yield of oats in the United States per state in the years 1869–1919, indicated by bushels per acre. A heavy black line indicates the extent of the 20...

Milk Sold from Farms, 1879
A map of the United States from the U. S. Department of Agriculture (1922) showing the number of gallons of milk sold from farms in 1879 by state. "The milk supply zones about the larger cities expanded between 1869 and 1879. Note the Philadelph...

Cheese Made on Farms, 1879
A map of the United States from the U. S. Department of Agriculture (1922) showing the distribution of cheese made on farms by state in 1879. "By 1879 cheese production on the farm had dwindled to one–ninth of the total production. The old...

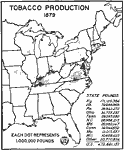
Tobacco Production, 1879
A map of the eastern United States from the U. S. Department of Agriculture (1922) showing tobacco producing areas and crop yield in 1879. Each dot represents 1,000,000 pounds of product. The total yield of tobacco for the United States in 1879 was 4...

Oat Production in the US, 1879
A map of the United States from the U. S. Department of Agriculture (1922) showing oat production in 1879, given in bushels. Each dot represents 200,000 bushels. The total yield of oats for the United States in 1879 was 407,858,999 bushels....

First Previous Next Last


  Maps > United States > Agriculture
Site Map  

Maps ETC is a part of the Educational Technology Clearinghouse
Produced by the Florida Center for Instructional Technology © 2009
College of Education, University of South Florida