Maps Site map
  Maps > United States > Demographics
Site Map  

  Record   21   to   30  of   33

A collection of historic population density and distribution maps of the United States for use in the K-12 classroom.

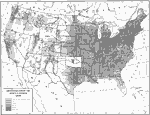
Distribution of Population, 1890
A map of the United States showing the distribution of the population in 1890. The map is keyed to show areas of population with densities ranging from under 2 inhabitants per square mile to 90 and over inhabitants per square mile....

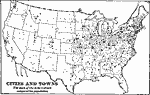
The United States - Cities and Towns, 1897
A base map from 1897 of the contiguous 48 states showing the distribution pattern of the major cities and towns at the time. The size of the dots indicate comparative populations....

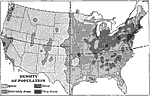
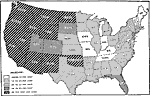
Density of Population, 1898
A map from 1898 showing the density of population in the contiguous 48 states at the time. The map is coded to show areas of density ranging from sparsely populated to areas of dense population. "The eastern half of the United States contains ne...

Population in the United States, 1900
A map from 1910 of the United States showing the distribution of the population in 1900. The map is keyed to show areas of population with densities ranging from under 2 inhabitants per square mile to 90 and over inhabitants per square mile. The mean...

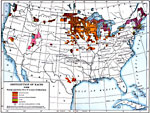
Distribution of Ethnicities in the United States, 1900
A map from 1907 of the United States showing concentrations and distribution of various European ethnic groups in 1900. The map is color–coded to show foreign populations where 8 percent or more of the inhabitants are Scandinavian, German, Nati...

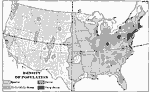
United States Population Density, 1900
A map from 1912 of the United States, subtitled "Distribution of Population and Railways in 1900" showing the increase in population and expansion of the railroad network since 1850. The map is color–coded to show population densities...

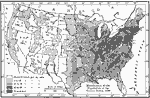
Distribution of European Races in the United States, 1900
A map from 1920 of the United States showing concentrations and distribution of various European ethnic groups in 1900. The map is color–coded to show foreign populations where 8 percent or more of the inhabitants are Scandinavian, German, Nati...

United States Growth in Population by Decades, 1900–1910
A map of the United States showing the increase in population per state between the 1900 and 1910 census. The map is keyed to show State population increases ranging from under 2 per cent to 50 per cent and over. "This is a map classifying state...

Density of Population in the U.S., 1901
A map from 1901 of the United States showing the population distribution at the time. The map is keyed to show areas of population densities ranging from sparse to very dense. This map is part of a classroom map study illustrating how, if the country...

The United States Population and Railroad Network, 1901
A map from 1901 of the United States showing population density, railroad lines, state capitals, and census centers of population at the time. The red figures indicate the mean population density per square mile for each state according to the census...

First Previous Next Last


  Maps > United States > Demographics
Site Map  

Maps ETC is a part of the Educational Technology Clearinghouse
Produced by the Florida Center for Instructional Technology © 2009
College of Education, University of South Florida