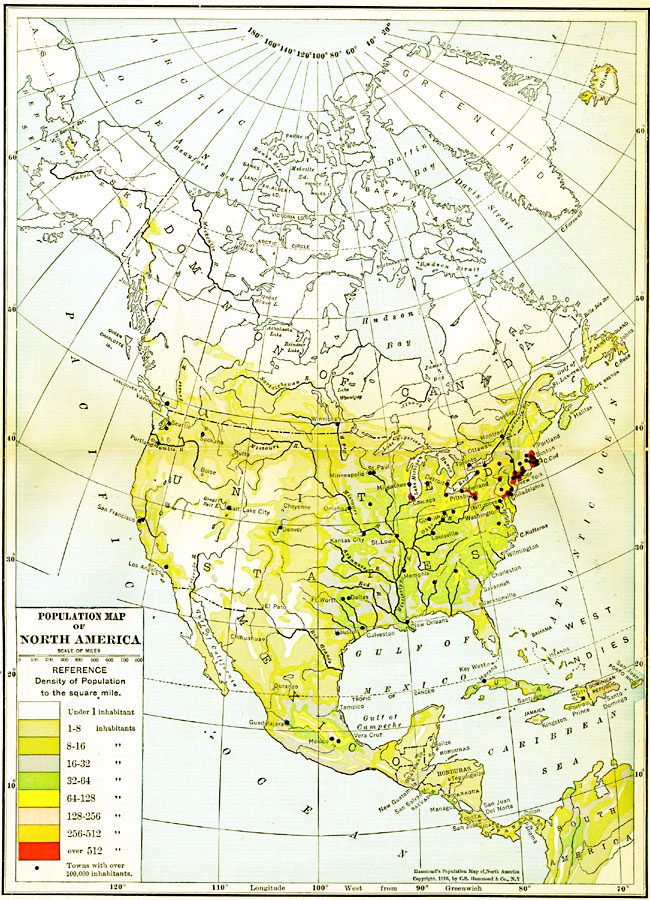
Description: A map from 1916 of North America, Central America, Greenland, and the Caribbean to Puerto Rico showing the population distribution at the time. The map is color–coded to show areas where the population density ranges from under 1 inhabitant per square mile to areas with over 512 inhabitants per square mile. Cities with populations over 100,000 inhabitants are shown.
Place Names: A Complete Map of North America, Bahamas, �Canada, �Cuba, �Mexico, �United States, �Greenland, Central Americ
ISO Topic Categories: boundaries,
inlandWaters,
location,
oceans,
society
Keywords: Population Distribution of North America, physical, �political, �statistical, kPopulation, physical features, country borders, population, boundaries,
inlandWaters,
location,
oceans,
society, Polyconic, 1916
Source: , Hammond's Business Atlas of Economic Geography (New York, NY: C.S. Hammond and Co., 1919) 6-7
Map Credit: Courtesy the private collection of Roy Winkelman |
|