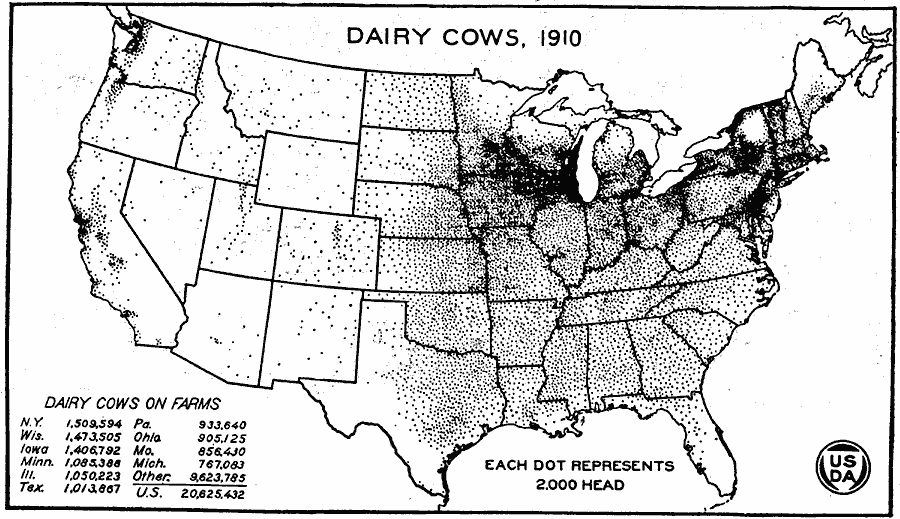
Description: A map of the United States from the U. S. Department of Agriculture (1922) showing the distribution of Milch Cows in the United States in 1910. "A marked increase in dairy cows may be noted in the Pacific Coast States. Wisconsin continued to increase the number of cows taking second place. Minnesota dairying was also developing rapidly. Cows were decreasing in southern New England. The figures for 1910 are not strictly comparable with those for 1900, since the 1910 census included younger cows than were included in 1900." — United States Department of Agriculture Yearbook 1922, 1923.
Place Names: Agriculture, New York, Wisconsin, Iowa, Minnesota, Illinois, Texas, Pennsylvania, Ohio, Missouri, Michigan, �cattl
ISO Topic Categories: boundaries,
inlandWaters,
farming
Keywords: Milch Cow Distribution, physical, �political, �statistical, �milch cow distribution, milk cow, dairy cow, kAgriculture, physical features, country borders,
major political subdivisions, agriculture, boundaries,
inlandWaters,
farming, Unknown, 1910
Source: , United States Department of Agriculture Yearbook 1922 (Washington, DC: Government Printing Office, 1923) 301
Map Credit: Courtesy the private collection of Roy Winkelman |
|