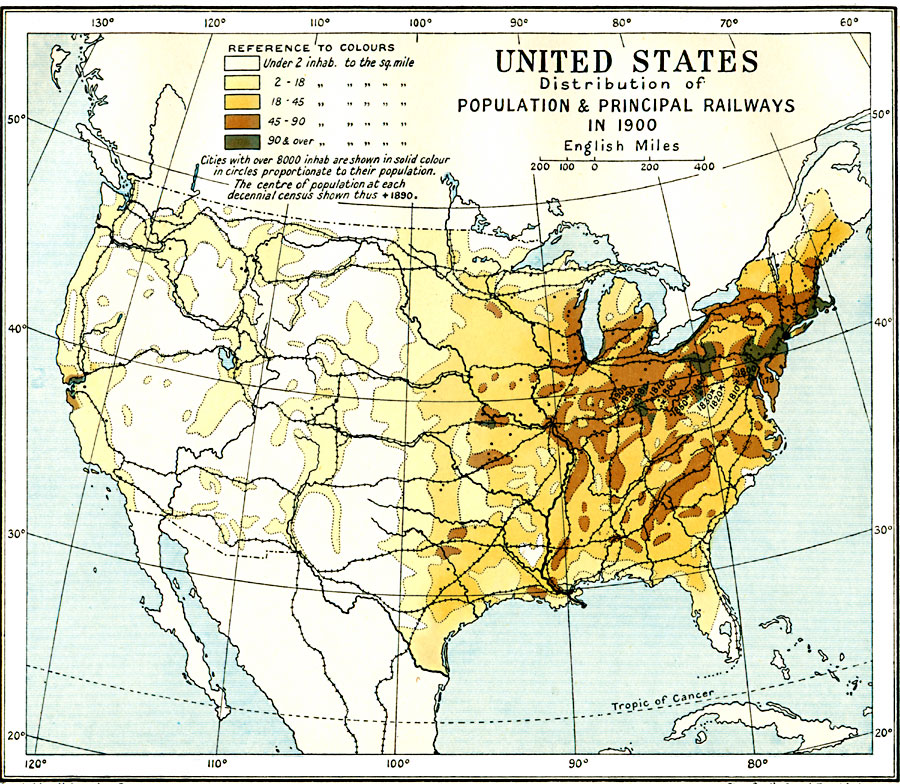
Description: A map from 1912 of the United States, subtitled "Distribution of Population and Railways in 1900" showing the increase in population and expansion of the railroad network since 1850. The map is color–coded to show population densities ranging from areas with fewer than 2 inhabitants per square mile to areas of 90 or more inhabitants per square mile. Cities with populations over 8,000 are shown with circles proportionate to their populations at the time. The map shows the westward progression of the mean centers of population from 1790 to 1900.
Place Names: Demographics, Boston, �Chicago, �Houston, �Los Angeles, �Miami, �New Orleans, �New York, �San Diego, �Seattle, �Washington D.C., �populatio
ISO Topic Categories: oceans,
location,
inlandWaters,
transportation
Keywords: United States Population Density, transportation, �statistical, kPopulation, kTransportation, population, railroads, oceans,
location,
inlandWaters,
transportation, Unknown, 1900
Source: Ward, Prothero, and Leathes, The Cambridge Modern History Atlas (New York, NY: The Macmillan Company, 1912)
Map Credit: Courtesy the private collection of Roy Winkelman |
|