Clipart tagged: ‘different’

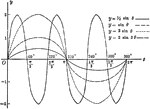
Sine Curves y= sin Ǝ, y= 1/2 sin Ǝ, y=2 sin Ǝ, y= 2 sin 3Ǝ
Sine curves of varying frequency and amplitude plotted from 0 to 2 pi. Graph of y= sin θ, y= 1/2…
Waves with Different Amplitudes with Equal Periods
"...represents two sets of sound waves with like periods and phases but different amplitudes." -Avery…