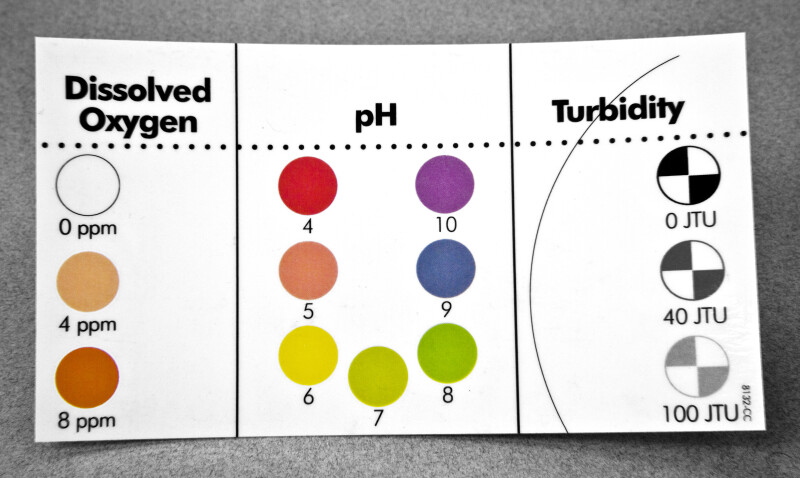
Chart for Reading Results of Dissolved Oxygen, pH, and Turbidity Tests
This chart helps students to read the results of three water quality tests. The dissolved oxygen indicators are used in conjunction with a temperature reading of the water sample to indicate the percentage of saturation of dissolved oxygen in the sample. The pH chart indicates the acidic or basic quality of the water sample. The Secchi disk indicated the level of turbidity of the sample.Galleries:Water Quality Monitoring, Water Quality TestingKeywords:dissolved oxygen, pH, turbidity, water monitoring, water qualityPhoto Location: FCIT Photo Studio, Tampa, FLPhotographer: Dr. Roy WinkelmanDate of Photo: 08/06/2013Device Make: CanonDevice Model: Canon EOS 5D Mark IIExposure Time: 0.0666667F Number: 22Original Dimensions: 5136×3072Picture Orientation: LandscapeGPS Coordinates: 28°3'40.85"N 82°24'36.26"WPicture Number: 23157
WARNING: You are about to download a 17.3 MB TIFF!
Normally such a large file is only needed for high quality printing purposes. If you are certain that you need such a large file, click the DOWNLOAD button to begin.
If you do not wish to download the large TIFF, just click the × in the top right-hand corner to close this alert.