|
|
|
| Maps > North America > Complete Maps |
Historic and contemporary maps of North America, including physical and political maps, early exploration maps, colonization period, Native American distribution, climate maps, relief maps, population density and distribution maps, vegetation maps, and economic/resource maps.
|
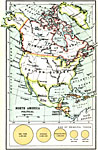
North America, Political,
1911 |
|
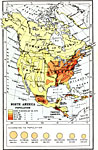
North America, Population,
1911 |

|
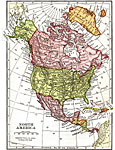
The Surface of North America,
1912 |
|
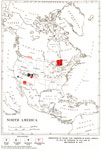
North America,
1912 |
|
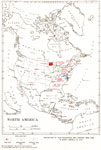
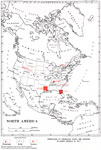
North America Production and Consumption of Nickel, Tungsten, Vanadium, and Molybdenum,
1912–1915 |
|
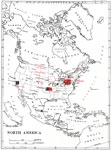
North America Production and Consumption of Iron, Manganese, and Chromic Iron Ores,
1913 |
|
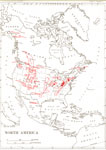
Production of Petroleum and Natural Gas in North America,
1913 |
|
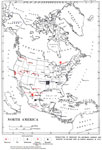
Production of Coal in North America,
1913 |
|
Production of Mercury, Tin, Antimony, Arsenic, and Bauxite in North America,
1913 |
|
Production of Phosphate, Pyrite, and Sulphur in North America,
1913 |
| First | Previous | Next | Last |
| Maps > North America > Complete Maps |
Maps ETC is a part of the Educational Technology Clearinghouse
Produced by the Florida Center for Instructional Technology © 2009
College of Education, University of South Florida