|
|
|
| Maps > United States > Meteorology |
A collection of meteorological maps of the United States, including mean annual temperature maps, precipitation records and distribution, and typical storm event patterns.
|
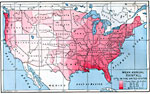
The United States: Rainfall,
1870–1901 |
|
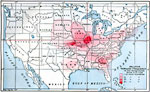
Relative Tornado Frequency in the United States,
1888 |
|
November Weather Map of Eastern United States,
1888 |
|
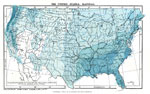
Mean Annual Rainfall in the United States,
1888 |
|
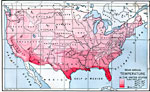
Mean Annual Temperature in the United States,
1888 |
|
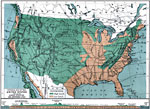
The United States Showing the Surface Structure and Isothermal Lines,
1891 |
|
Condition of the Weather on a certain day in April,
1891 |
|
A Typical Two–Day April Storm Event,
1891 |
|
Track of a Cyclone,
1893 |
|
Barometric Pressure and Weather,
1896 |
| Next | Last |
| Maps > United States > Meteorology |
Maps ETC is a part of the Educational Technology Clearinghouse
Produced by the Florida Center for Instructional Technology © 2009
College of Education, University of South Florida