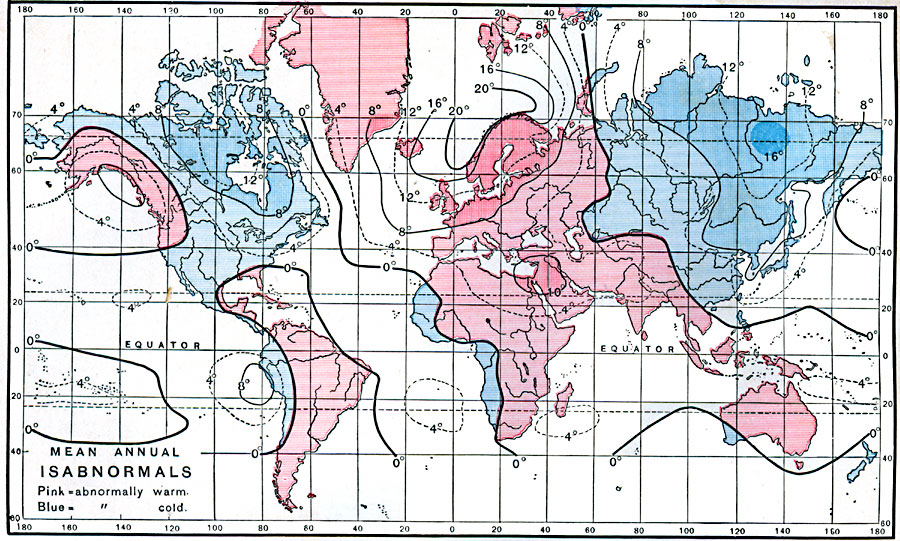
Description: A world map from 1888 showing the effect of ocean currents on regional temperatures. The map shows isabnormal lines of temperatures above or below the mean annual air temperature given in degrees Fahrenheit, and is color-coded to show areas abnormally warm (pinks) and abnormally cold (blues). "Ocean currents come from warmer or colder regions, and hence bring water abnormally warm or cold to the latitude; and this modifies the temperature of the overlying air. [...] Thus, the west coast of Africa, and the west coast of America from 40° N. to 40° S., are abnormally cool, while the east coasts of America from South Carolina to Cape Horn, and the whole east coasts of Africa and Australia have abnormally warm climates, owing to their adjacent ocean currents. It is only opposite the equatorial calms, in which the counter-current carries warm water eastward, that inter-tropical west coasts are not relatively cool. In higher latitudes (above 40° N. and S.) the warm currents wash the west coasts, and aid the west winds slightly in producing a moderate climate, while the cold currents adjacent to the opposite east coasts exercise an equal influence in depressing the climatic temperature." — Hinman, 1888, pp. 304-306.
Place Names: A Complete Map of Globes and Multi-continent, Africa, �Asia, �Australia, �Europe, �North America, �South Americ
ISO Topic Categories: oceans,
location,
inlandWaters,
climatologyMeteorologyAtmosphere
Keywords: Effect of Ocean Current on Temperatures, physical, �hydrological, �meteorological, kClimate, physical features, temperature, currents, oceans,
location,
inlandWaters,
climatologyMeteorologyAtmosphere, Unknown, 1888
Source: Russell Hinman, Eclectic Physical Geography (Cincinnati, Ohio: Houghton Mifflin Company, 1888) 305
Map Credit: Courtesy the private collection of Roy Winkelman |
|