Clipart tagged: ‘coordinate axis’

Projection of Points in Circular Motion
Illustration of the projection of point P as it moves around a vertical circle of radius 3 in. in a…

Projection of Points in Circular Motion
Illustration of the projection of point P as it moves around a vertical circle of radius 2 ft. in a…

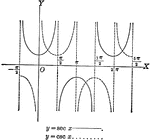
Secant and Cosecant Curves, y=sec x and y=csc x
Secant and Cosecant curves plotted from negative pi to 2 pi. Graph of y=sec x and y=csc x.

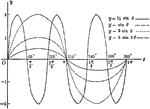
Sine Curves y= sin Ǝ, y= 1/2 sin Ǝ, y=2 sin Ǝ, y= 2 sin 3Ǝ
Sine curves of varying frequency and amplitude plotted from 0 to 2 pi. Graph of y= sin θ, y= 1/2…

Sine Curves y= sin t, y= r sin1/2t, y= r sin 2t
Sine curves of varying frequency plotted from 0 to 2 pi. Graph of y= sin t, y= r sin1/2t, y=r sin 2t.

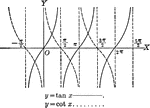
Tangent and Cotangent Curves, y=tan x and y=cot x
Tangent and Cotangent curves plotted from negative pi to 2 pi. Graph of y=tan x and y=cot x.

