Clipart tagged: ‘tangent curve’

Tangent and Cotangent Curves, y=tan x and y=cot x
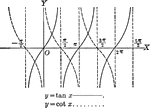
Tangent and Cotangent curves plotted from negative pi to 2 pi. Graph of y=tan x and y=cot x.

Tangent and Cotangent curves plotted from negative pi to 2 pi. Graph of y=tan x and y=cot x.