Return to top of page
|
|||||||
| ETC > NSA Home > Mathematics 3-5 > Graphing Process | |||||||

ETC > NSA Home > Mathematics 3-5 > Graphing Process
Graphing Process
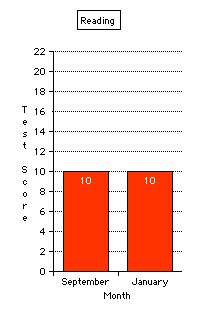
Use Appleworks spreadsheet to allow your students to graph their progress through the year.
Objectives
- Students understand and use the tools of data analysis for managing information to analyze real-world data to recognize patterns and relationships of the measures.
- Students use statistical methods to make references and valid arguments about real-world situations.
Procedure
- Prepare (or edit the one provided) a template that generates a graph after students enter their data.
- Give assessments three times a year and allow students to enter the data.
- Teach students to look at their strengths and weaknesses and to make goals to improve based on what the data shows.
Sunshine State Standards
- MA.3.S.7.1
NETS Profiles for Technology Literate Students
- Use general purpose productivity tools and peripherals to support personal productivity, remediate skill deficits, and facilitate learning throughout the curriculum.
- Use technology tools (e.g., multimedia authoring, presentation, Web tools, digital cameras, scanners) for individual and collaborative writing, communication, and publishing activities to create knowledge products for audiences inside and outside the classroom.
Materials
- Appleworks spreadsheet
- Beginning, middle, and end of the year assessment
Downloads
Alternatives/Extensions
- Track behavior data
Return to top of page
Return to lesson plans menu
ETC > NSA Home > Mathematics 3-5 > Graphing Process