Maps Site map
  Maps > United States > Meteorology
Site Map  

  Record   21   to   30  of   90

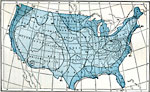
A collection of meteorological maps of the United States, including mean annual temperature maps, precipitation records and distribution, and typical storm event patterns.
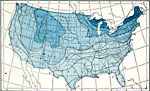
Annual Snowfall, 1896
A map from 1896 of the United States showing mean annual snowfall distribution with depths given in inches....

Days with Precipitation, 1896
A map from 1896 of the United States showing the mean number of days during the year with precipitation, including rainfall and snowfall....

Consecutive Days with Precipitation, 1896
A map from 1896 of the United States showing the mean greatest number of consecutive days with precipitation over a one year period....

Drought Conditions, 1896
A map from 1896 of the United States showing the mean annual greatest number of days without precipitation (drought conditions)....

Relative Humidity, 1896
A map from 1896 of the United States showing the average relative humidity for the region, given in the percentage of water per cubic foot of surface air relative to air temperature....

Midwinter Cloudiness, 1896
A map from 1896 of the United States showing the percentage of cloudiness in the region for the month of January (midwinter), where 0% is clear and 100% is completely cloudy. "In the extreme northwest of the United States there is a cloudiness o...

Midsummer Cloudiness, 1896
A map from 1896 of the United States showing the percentage of cloudiness in the region for the month of August (midsummer), where 0% is clear and 100% is completely cloudy. "The cloudiness in August is least in the Sierra Nevada region, where i...

Wind Velocities, 1896
A map from 1896 of the United States showing the average wind velocities for the year (in miles per hour)....

Rain–Bearing Wind Direction, 1896
A map from 1896 of the United States showing the prevailing directions of rain–bearing winds, or winds most likely to be followed by rain....

Thunderstorm Frequency, 1896
A map from 1896 of the United States showing the annual average number of thunderstorms (solid lines) and the months of maximum thunderstorm activity (dashed lines)....

First Previous Next Last


  Maps > United States > Meteorology
Site Map  

Maps ETC is a part of the Educational Technology Clearinghouse
Produced by the Florida Center for Instructional Technology © 2009
College of Education, University of South Florida