Maps Site map
  Maps > United States > Meteorology
Site Map  

  Record   31   to   40  of   90

A collection of meteorological maps of the United States, including mean annual temperature maps, precipitation records and distribution, and typical storm event patterns.

Heat Belts in the United States, 1898
A map from 1898 showing the heat belts in North America. "The north temperate heat belt travels northward in summer and southward in winter...In summer it [the heat belt] is so far north that its southern edge occupies the position represented b...

Number of Freezing Days in the United States, 1898
A map from 1898 of the United States showing the average annual number of freezing days in North America. "The number of freezing days in a year increases northwardly over the shaded portion of the chart, the first line showing where there are t...

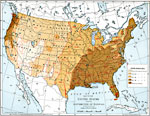
Rainfall in the United States, 1898
A map from 1898 of the United States showing the general annual rainfall distribution. "The regions shaded by lines would each year be covered more than twenty inches deep by the rainfall, if the water remained where it fell. This amount is ampl...

A Cyclone in the United States, 1898
A map from 1898 showing typical cyclone formation and movement in North America. "The effect of a cyclonic storm upon the weather is illustrated by the chart...The point of the heavy arrow lies in a storm center, around and into which the winds ...

Mean Annual Rainfall in Inches, 1899
A map from 1899 of the United States showing the mean annual rainfall distribution for the region. The map is keyed to show rainfall ranging from 10 inches and below to 70 inches and over....

Maximum Rainfall, 1899
A base map from 1899 of the United States showing the periodic rainfall distribution for the Pacific, Missouri, St. Lawrence, Atlantic, Tennessee, and Mexico regions, indicating the months of heaviest rainfall in each....

United States Climate, 1901
A series of three climate maps from 1901 showing the general heat belts, mean number of freezing days, and rainfall distribution in the United States. The left–hand map shows the southern limit of the January cold belt (isotherm of 30° F.) ...

Typical Cyclone Events, 1901
A map from 1901 of the United States showing typical cyclonic storm activity. The map shows the storm track (solid line) and position of the storm center at 24 hour intervals (A, B, and C), and the projected track (dashed line) locations (D and E), a...

United States Showing Distribution of Rainfall, 1901
A map from 1901 of the United States showing the mean annual distribution of rainfall given in inches per year. The map is color&ndash:coded to show rainfall ranging from below 10 inches to 70 inches or over per year. Isolines on the map identify are...

Average Temperature in January, 1906
A map from 1906 of the United States showing isotherms of mean surface temperatures in the region for the month of January....

First Previous Next Last


  Maps > United States > Meteorology
Site Map  

Maps ETC is a part of the Educational Technology Clearinghouse
Produced by the Florida Center for Instructional Technology © 2009
College of Education, University of South Florida