Maps Site map
  Maps > United States > Meteorology
Site Map  

  Record   41   to   50  of   90

A collection of meteorological maps of the United States, including mean annual temperature maps, precipitation records and distribution, and typical storm event patterns.

Average Temperature in July, 1906
A map from 1906 of the United States showing isotherms of mean surface temperatures in the region for the month of July....

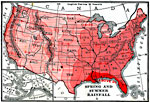
Spring and Summer Rainfall in the United States, 1906
A map from 1906 of the United States showing average spring and summer rainfall distribution, keyed to show areas of less than 10 inches in the season to more than 30 inches....

Mean Annual Rainfall of the United States, 1910
A map from 1910 of the United States showing the mean annual rainfall distribution. The map is color–coded to show areas of rainfall ranging from under 5 inches annually to over 60 inches....

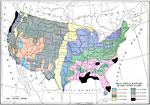
Winter Weather of the United States, 1910
A sample weather map from 1910 of the United States showing typical weather patterns and a winter storm event. The map shows a low pressure system in the Northern Plains and in the Northeast, a high pressure system over the coastal Pacific and Ohio V...

Weather Map of the United States, 1910
A sample weather map from 1910 of the United States showing typical weather patterns and a winter storm event. The map shows a low pressure system moving from the Northern Plains into the Great Lakes region and in the Northeast, a high pressure syste...

Isothermal Chart of the United States for January, 1910
A map from 1910 of the United States showing the isobars of mean temperatures typical for the month of January, given in degrees Fahrenheit. The map is keyed to show the cold areas of mean temperatures below the 30° isotherm, and the more tempera...

Isothermal chart of the United States for July, 1910
A map from 1910 of the United States showing the isobars of mean temperatures typical for the month of July, given in degrees Fahrenheit. The map is keyed to show the hot areas of mean temperatures above the 80° isotherm....

United States Weather on a Winter's Day, 1910
A sample weather map from 1910 of the United States for a typical winter's day. The isobars are lines of equal air pressure, with the lower the figure the lighter the air. The pressure is determined by an instrument called the barometer....

Isothermal chart of the United States for January, 1910
A map from 1910 of the United States showing the mean temperatures in degrees Fahrenheit for the month of January. The map is coded to show the southern extent of the cold belt (below 30° F.) and northern extent of the temperate belt (above 50&de...

Isothermal chart of the United States for July, 1910
A map from 1910 of the United States showing the mean temperatures in degrees Fahrenheit for the month of July. The map is coded to show the northern extent of the heat belt (above 80° F.)....

First Previous Next Last


  Maps > United States > Meteorology
Site Map  

Maps ETC is a part of the Educational Technology Clearinghouse
Produced by the Florida Center for Instructional Technology © 2009
College of Education, University of South Florida