Maps Site map
  Maps > United States > Agriculture
Site Map  

  Record   31   to   40  of   141

A collection of agricultural production and agricultural related maps in the United States for use in the K-12 classroom.

Barley Production in the US, 1879
A map of the United States from the U. S. Department of Agriculture (1922) showing the average yield of barley production in 1879. Each dot represents 100,000 bushels. The total yield of barley for the United States in 1879 was 43,997,495 bushels....

Rye Production in the United States, 1879
A map of the United States from the U. S. Department of Agriculture (1922) showing the average yield of rye production in 1879. Each dot represents 25,000 bushels. The total yield of rye for the United States in 1879 was 19,831,595 bushels....

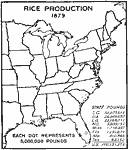
Rice Production in the United States, 1879
A map of the eastern United States from the U. S. Department of Agriculture (1922) showing the average yield of rice production in 1879. Each dot represents 5,000,000 pounds. The total yield of rice for the United States in 1879 was 110,131,373 pound...

Flaxseed production in the United States, 1879
A map of the United States from the U. S. Department of Agriculture (1922) showing the average yield of flaxseed production in 1879. Each dot represents 25,000 bushels. The total yield of flaxseed for the United States in 1879 was 7,170,951 bushels....

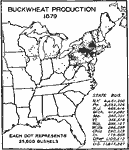
Buckwheat Production in the United States, 1879
A map of the eastern United States from the U. S. Department of Agriculture (1922) showing the average yield of buckwheat production in 1879. Each dot represents 25,000 bushels. The total yield of buckwheat for the United States in 1879 was 11,817,32...

United States Production of Hogs, 1880
A map of the United States from the U. S. Department of Agriculture (1923) showing the numbers and location of hogs produced in the United States in 1880. "The center of greatest production had shifted by 1880 to western Illinois, eastern and so...

Milch Cow Distribution, 1880
A map of the United States from the U. S. Department of Agriculture (1922) showing the distribution of Milch Cows in the United States in 1880. "Between 1870 and 1880 the number of cows increased nearly 50 per cent. The greatest increases were i...

Cheese Made on Farms, 1889
A map of the United States from the U. S. Department of Agriculture (1922) showing the distribution of cheese made on farms by state in 1889. "North Dakota, Idaho, and Utah each reported about 200,000 pounds of cheese for 1889. Kansas and Nebras...

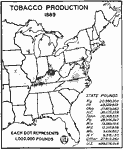
Tobacco Production, 1889
A map of the eastern United States from the U. S. Department of Agriculture (1922) showing tobacco producing areas and crop yield in 1889. Each dot represents 1,000,000 pounds of product. The total yield of tobacco for the United States in 1889 was 4...

Oat Production in the US, 1889
A map of the United States from the U. S. Department of Agriculture (1922) showing oat production in 1889, given in bushels. Each dot represents 200,000 bushels. The total yield of oats for the United States in 1889 was 809,250,666 bushels....

First Previous Next Last


  Maps > United States > Agriculture
Site Map  

Maps ETC is a part of the Educational Technology Clearinghouse
Produced by the Florida Center for Instructional Technology © 2009
College of Education, University of South Florida