Maps Site map
  Maps > United States > Agriculture
Site Map  

  Record   81   to   90  of   141

A collection of agricultural production and agricultural related maps in the United States for use in the K-12 classroom.
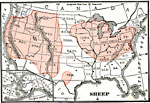
Sheep Farming Regions of the United States, 1906
A map from 1906 of the United States showing the principal sheep raising regions of the country at the time....

Milk Sold from Farms, 1909
A map of the United States from the U. S. Department of Agriculture (1922) showing the number of gallons of milk sold from farms in 1909 by state. "On this map groups of dots generally locate large cities. In the larger black areas milk is also ...

Cheese Made on Farms, 1909
A map of the United States from the U. S. Department of Agriculture (1922) showing the distribution of cheese made on farms by state in 1909. "Farm cheese production had almost completely disappeared from most States by 1909. It is interesting t...

Barley Production in the US, 1909
A map of the United States from the U. S. Department of Agriculture (1922) showing the average yield of barley production in 1909. Each dot represents 100,000 bushels. The total yield of barley for the United States in 1909 was 173,344,212 bushels....

Rye Production in the United States, 1909
A map of the United States from the U. S. Department of Agriculture (1922) showing the average yield of rye production in 1909. Each dot represents 25,000 bushels. The total yield of rye for the United States in 1909 was 29,520,457 bushels....

Flaxseed production in the United States, 1909
A map of the United States from the U. S. Department of Agriculture (1922) showing the average yield of flaxseed production in 1909. Each dot represents 25,000 bushels. The total yield of flaxseed for the United States in 1909 was 19,512,765 bushels....

Milch Cow Distribution, 1910
A map of the United States from the U. S. Department of Agriculture (1922) showing the distribution of Milch Cows in the United States in 1910. "A marked increase in dairy cows may be noted in the Pacific Coast States. Wisconsin continued to inc...

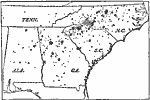
Cotton Manufacturing in the South, 1910
A map from 1910 of the southeastern United States showing the extent of cotton manufacturing in the South at the time. Each dot represents one mill....

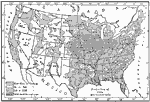
Corn Production in the United States, 1910
A map from 1910 of the United States showing the corn producing regions at the time. The map is keyed to show areas of corn production ranging from less than 64 bushels per square mile to 3,200 bushels and over based on records from 1906....

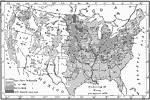
Wheat Regions of the United States, 1910
A map from 1910 of the United States showing the wheat producing regions at the time. The map is keyed to show areas of wheat production ranging from less than 64 bushels per square mile to 3,200 bushels and over based on records from 1907....

First Previous Next Last


  Maps > United States > Agriculture
Site Map  

Maps ETC is a part of the Educational Technology Clearinghouse
Produced by the Florida Center for Instructional Technology © 2009
College of Education, University of South Florida