Maps Site map
  Maps > United States > Demographics
Site Map  

  Record   31   to   33  of   33

A collection of historic population density and distribution maps of the United States for use in the K-12 classroom.

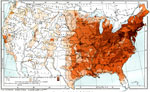
The United States: Density of Population, 1904
A map from 1904 of the United States, showing the averaged population density per square mile based on the census of 1900, ranging from under 2 inhabitants to the square mile to over 90 inhabitants to the square mile....

United States City Distributions, 1906
A map from 1906 of the United States showing the general distribution of cities and towns at the time. The dots on this map show cities and towns, the largest cities are shown by the largest dots. — Frye's First Steps in Geography, 1906....

Population Density, 1910
A map of the United States showing the distribution of the population in 1910. The map is keyed to show areas of population with densities ranging from under 2 inhabitants per square mile to 90 and over inhabitants per square mile. The figures in cir...

First Previous


  Maps > United States > Demographics
Site Map  

Maps ETC is a part of the Educational Technology Clearinghouse
Produced by the Florida Center for Instructional Technology © 2009
College of Education, University of South Florida