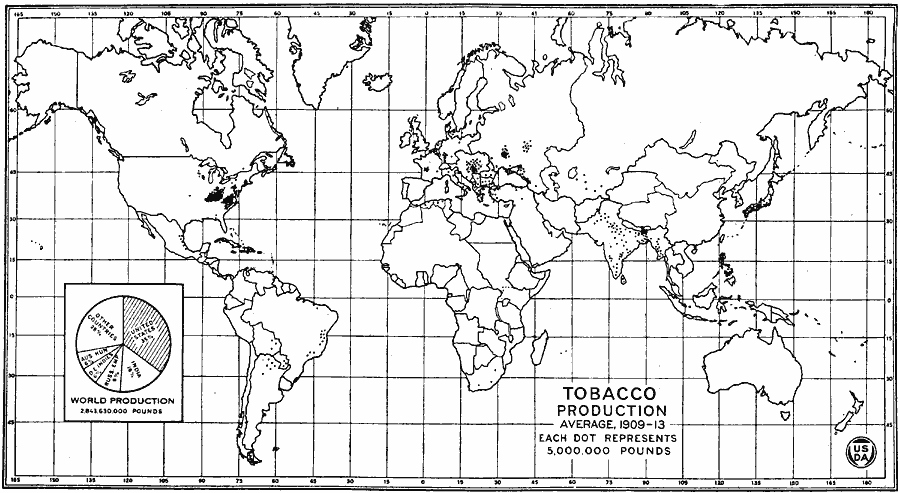
Description: A map from the United States Department of Agriculture showing centers of production of tobacco across the world between 1909 and 1913. Each dot on this map represents the production of 5,000,000 pounds of tobacco in this period, and the map includes a pie–chart showing the percentages of the world's production of 2,843,630,000 pounds of tobacco. According to this map, the United States produced 35 percent of the world's tobacco at the time.
Place Names: A Complete Map of Globes and Multi-continent, Africa, �Asia, �Australia, �Europe, �North America, �South Americ
ISO Topic Categories: boundaries,
oceans,
farming,
inlandWaters
Keywords: Average World Tobacco Production, physical, �political, �statistical, �world tobacco production location, production centers, tobacco farming areas, kAgriculture, physical features, major political subdivisions,
country borders, agriculture, boundaries,
oceans,
farming,
inlandWaters, Unknown, 1909–1913
Source: , United States Department of Agriculture Yearbook 1922 (Washington D.C., Washington D.C.: Government Printing Office, 1923) 397
Map Credit: Courtesy the private collection of Roy Winkelman |
|