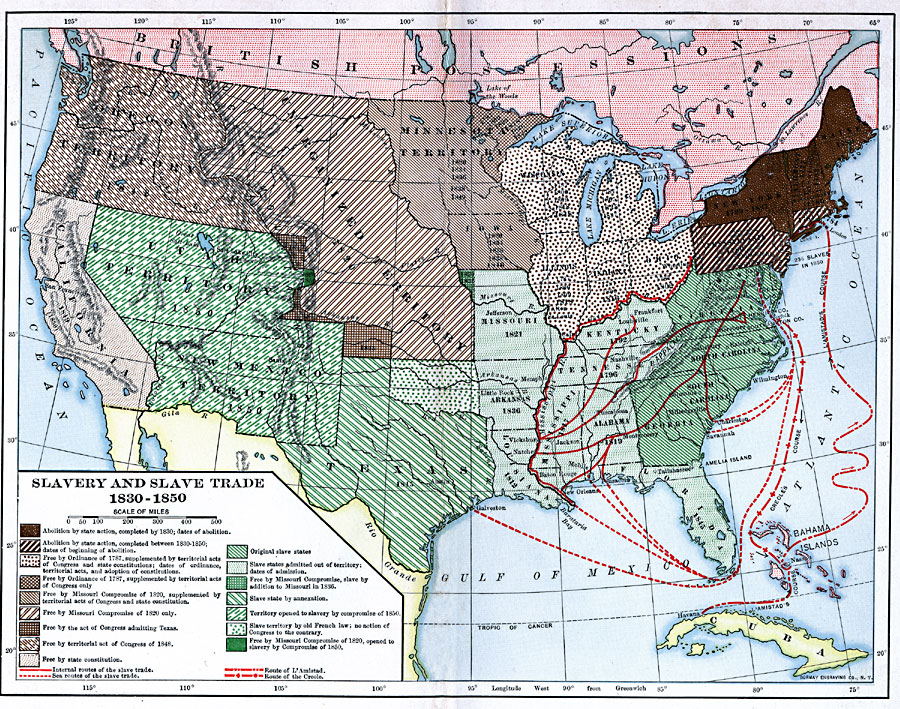
Description: A map of the United States during the period of 1850 to 1850 showing the effects of slavery, the slave trade, and the abolition movement on territorial development. The map uses colored patterns to indicate the areas and phases of abolition and admission to the Union, including the original slave states, abolition by state action, free by the Ordinance of 1787, free by the Missouri Compromise of 1820, free by the territorial act of Congress, free by state constitution, slave by addition to Missouri in 1836, slave territory by old French law, and slave state by annexation. The map shows the internal and sea routes of the slave trade, and the routes of the slave rebellions onboard the Amistad from Havana to Long Island (1839), and onboard the Creole from Hampton Roads to Nassau in the Bahamas (1841).
Place Names: Growth of Nation, Philadelphia, �Washington D.C., �New Orleans, �Slavery, �Slave Trade, �Civil War,
ISO Topic Categories: boundaries,
location,
inlandWaters,
oceans,
transportation
Keywords: Slavery and the Slave Trade, physical, �political, �transportation, physical features, country borders,
major political subdivisions, roads,
water routes, boundaries,
location,
inlandWaters,
oceans,
transportation, Unknown, 1830–1850
Source: Albert Bushnell Hart, LL.D., The American Nation Vol.16 (New York, NY: Harper and Brothers, 1906) 126
Map Credit: Courtesy the private collection of Roy Winkelman |
|