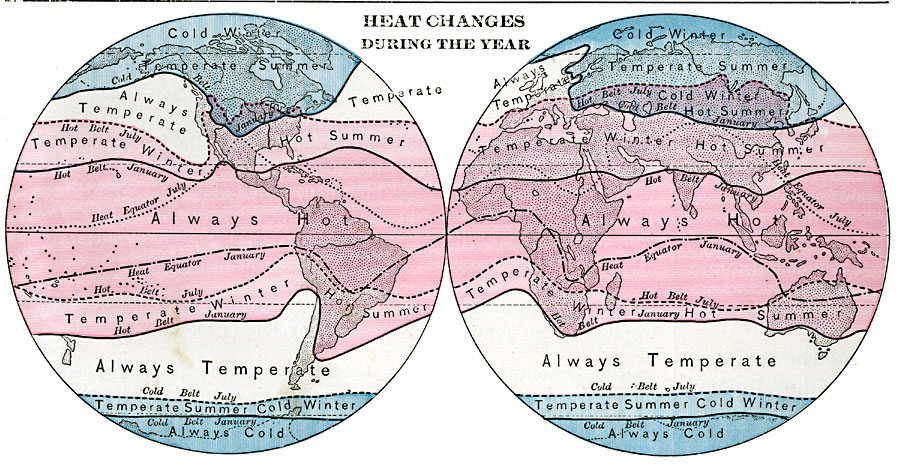
Description: A double hemisphere map of the earth from 1901 showing the Heat Equator (defined by the highest mean annual temperature at each longitude around the globe, not by latitude), and changes of the Cold Belt, Temperate Belt, and Hot Belt of the East and West hemispheres over the course of a year. The map shows the belt boundaries in January as solid lines and the boundaries in July as dashed lines. The map shows expansion and overlap of the belts over the year. The distance and irregularity of the Heat Equator away from the geographic Equator illustrates the effect of land masses and water masses on mean annual temperatures.
Place Names: A Complete Map of Globes and Multi-continent, Africa, �Antarctica, �Asia, �Australia, �Europe, �North America, �South Americ
ISO Topic Categories: climatologyMeteorologyAtmosphere,
inlandWaters,
oceans
Keywords: Heat Changes During the Year, physical, �meteorological, kClimate, physical features, climate,
temperature, climatologyMeteorologyAtmosphere,
inlandWaters,
oceans, Unknown, 1901
Source: Jacques W. Redway, Natural Advanced Geography (New York, New York: American Book Company, 1901) 25
Map Credit: Courtesy the private collection of Roy Winkelman |
|