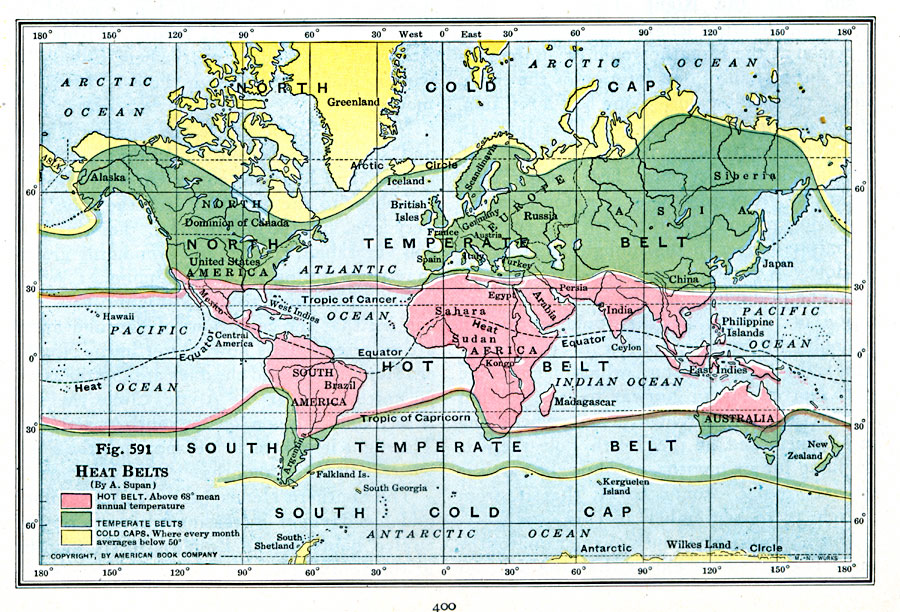
Description: A world map from 1916 showing the Earth's heat belts. This map is color-coded to show the Hot Belt where temperatures are above 68° mean annual temperature, Temperate Belt, and Cold Caps, where every month averages below 50deg;. The map also shows both the geographic Equator and the Heat Equator (defined by the highest mean annual temperature at each longitude around the globe, not by latitude). "The hot belt is bounded by lines of mean annual temperature; but the temperature belts extend poleward to the line of 50° average temperature for the hottest month. The hot belt is on both sides of the Equator, but more in the Northern Hemisphere than in the Southern. The north temperature belt is much broader than the south temperature belt and more irregular in outline; it includes nearly half of the land surface of the earth. The temperate belts include some regions of mild temperature and some regions of cold winters and warm summers." — Houston, 1916, p. 402
Place Names: A Complete Map of Globes and Multi-continent, Africa, �Antarctica, �Asia, �Australia, �Europe, �North America, �South Americ
ISO Topic Categories: location,
oceans,
inlandWaters,
climatologyMeteorologyAtmosphere
Keywords: Heat Belts of the World, physical, �meteorological, kClimate, physical features, temperature, location,
oceans,
inlandWaters,
climatologyMeteorologyAtmosphere, Unknown, 1916
Source: Albert Perry Brigham & Charles T. McFarlane, Essentials of Geography (New York, NY: American Book Company, 1916) 400
Map Credit: Courtesy the private collection of Roy Winkelman |
|