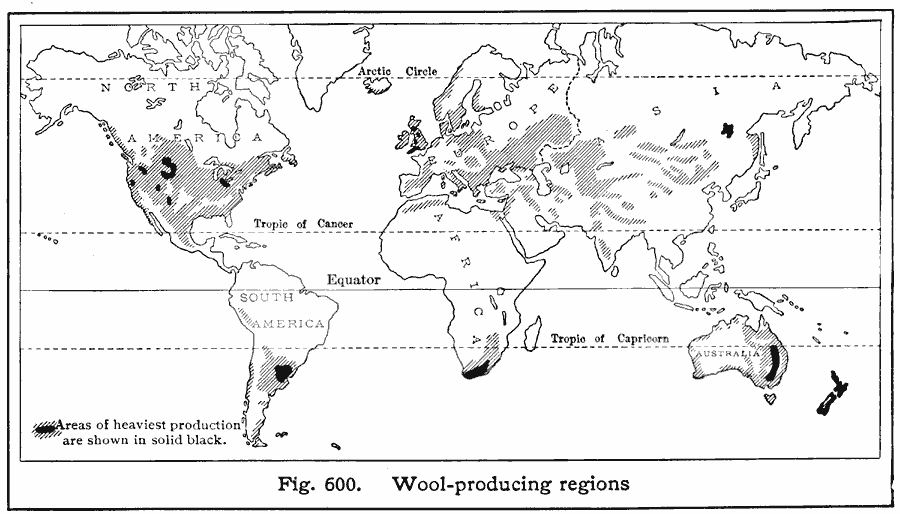
Description: A world map from 1916 showing the principal wool-producing regions of the world at the time, showing areas of production in hatchures, with the regions of heaviest production in black. Based on five-year averages; "WorldŐs annual exports of wool reported from all countries, 2,200,000,000 pounds. Leading wool-exporting countries, with percentages of exports reported for all countries: Australia (30%), Argentina (15%), New Zealand (9%), British South Africa (8%), Uruguay (7%). Among the wool-importing countries, France and Great Britain lead, each taking about one fourth of the worldŐs imports. Germany before the war imported less than either France or Great Britain, but twice as much as the United States. The scoured wool produced in the United States averages 122,000,000 pounds a year. Leading wool-producing states, with percentages of United States production: Wyoming (11%), Montana (9%), Ohio (7%), New Mexico (7%), Idaho (6%), Utah (5 ½%), Oregon (5%)."
Place Names: A Complete Map of Globes and Multi-continent, Antarctica, �Africa, �Asia, �Europe, �Australia, �North America, �South Americ
ISO Topic Categories: farming,
location,
oceans
Keywords: World Wool Production, physical, kAgriculture, physical features, farming,
location,
oceans, Unknown, 1916
Source: Albert Perry Brigham & Charles T. McFarlane, Essentials of Geography (New York, NY: American Book Company, 1916) 406
Map Credit: Courtesy the private collection of Roy Winkelman |
|