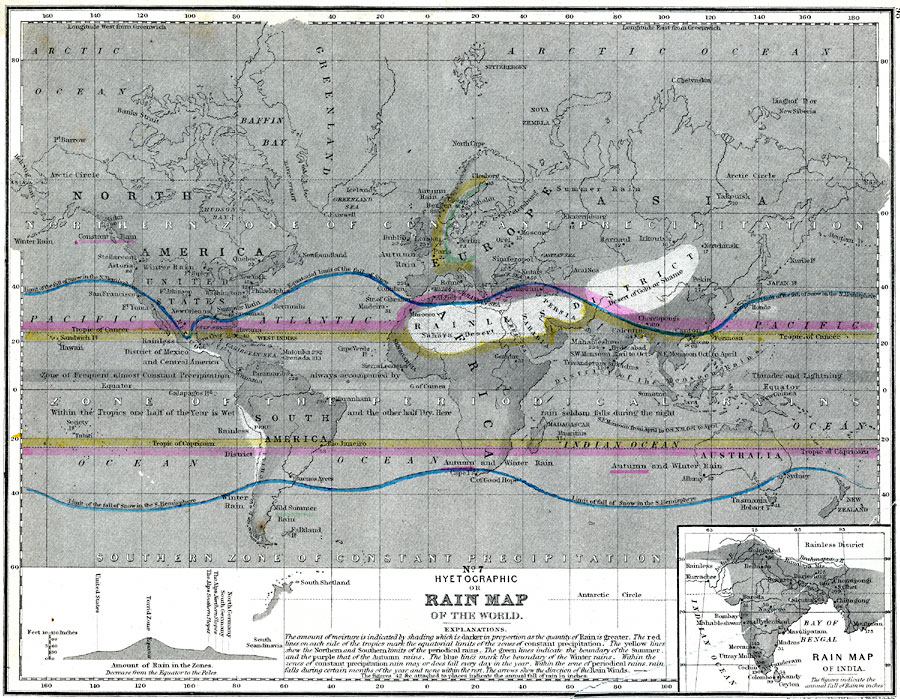
Description: A Hyetographic or rain map of the world from 1890. The map shows the northern and southern limits of snowfall, the latitudes of the Arctic Circle and tropics of Cancer and Capricorn, and specific cities with figures indicating inches of annual precipitation. A graph at the bottom of the map shows the amount of rainfall in the zones from the poles to the equator, with sample points to illustrate how rainfall decreases from the Torrid Zone at the equator toward the poles, and the rain-shadow effect of mountains (southern and northern slopes of the Alps). An inset map details the rainfall in India, with figures showing the mean annual rainfall in inches. "The amount of moisture is indicated by shading which is darker in proportion as the quantity of Rain is greater. The red lines on each side of the tropics mark the equatorial limits of the zones of constant precipitation. The yellow lines show the Northern and Southern limits of the periodical rains. The green lines indicate the boundary of Summer, and purple that of the Autumn rains. The blue lines mark the boundary of the Winter rains. Within the zones of constant precipitation rain may or does fall every day in the year. Within the zone of periodical rains, rain falls during certain months of the year, and none within the rest. The arrows show the direction of the Rain Winds.
Place Names: A Complete Map of Globes and Multi-continent, Africa, �Asia, �Australia, �Europe, �North America, �South Americ
ISO Topic Categories: inlandWaters,
location,
oceans,
climatologyMeteorologyAtmosphere
Keywords: Hyetographic or Rain Map of the World, physical, �meteorological, kClimate, physical features, rainfall, inlandWaters,
location,
oceans,
climatologyMeteorologyAtmosphere, Unknown, 1890
Source: John Brocklesby, Elements of Physical Geography (Philadelphia, Pennsylvania: E. H. Butler and Co., 1890) 98
Map Credit: Courtesy the private collection of Roy Winkelman |
|