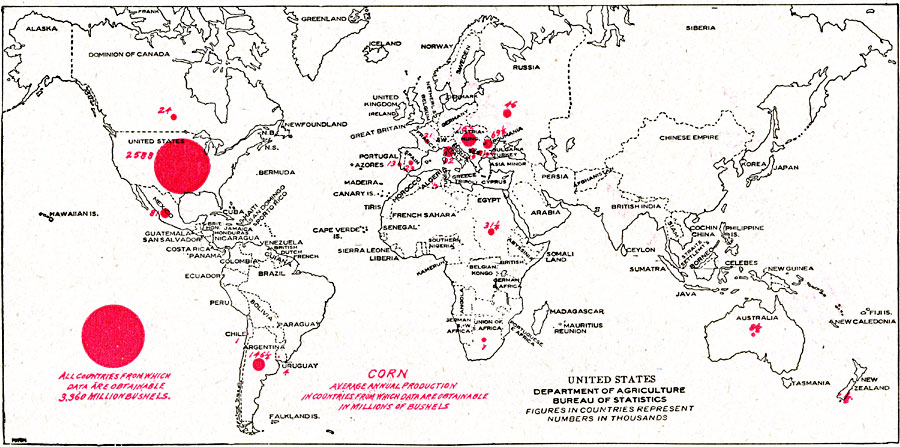
Description: A map from 1912 showing the world distribution of corn production according to the United States Department of Agriculture, Bureau of Statistics. The average annual total corn production of all countries from which data are obtainable at the time is 3,360 million bushels. This map uses dot–symbols to show quantities of production, with the larger the symbol, the more production. The red figure in countries next to the symbols represents numbers in thousands.
Place Names: A Complete Map of Globes and Multi-continent, Africa, �Asia, �Australia, �Europe, �North America, �South Americ
ISO Topic Categories: farming,
boundaries,
location,
oceans,
economy
Keywords: World Distribution of Corn Production, statistical, kAgriculture, agriculture, farming,
boundaries,
location,
oceans,
economy, Unknown, 1912
Source: , The American Library Atlas of the World (Chicago, Illinois: Geographical Publishing Co., 1912) 94
Map Credit: Courtesy the private collection of Roy Winkelman |
|