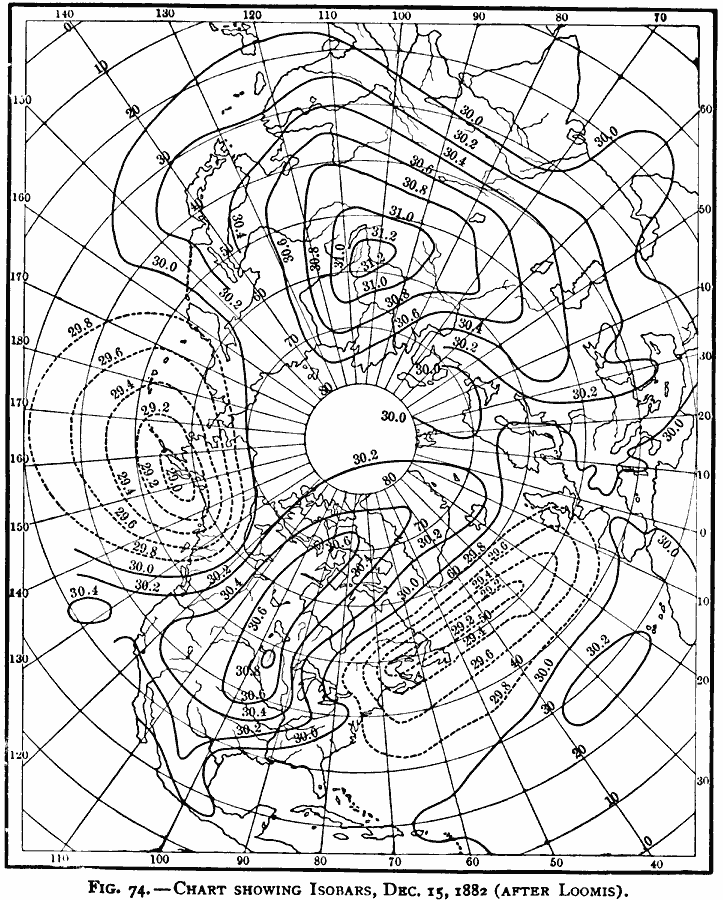
Description: A chart of the northern hemisphere showing barometric pressure on December 15, 1882. The map shows isobars, or lines drawn through places of equal atmospheric pressure, denoting the mean or a high pressure (30 inches or over) being drawn with solid lines, while isobars of low pressure (less than 30 inches) are drawn with dashed lines. "The simultaneous distribution of cyclones and anticyclones over the northern hemisphere is shown, which gives the isobars on December 15, 1882. This shows an area of high pressure (an anticyclone) over North America, and one over Asia, with areas of low pressure (cyclones) over the eastern Pacific Ocean and the North Atlantic Ocean. A less pronounced anticyclone is also to be seen over the southern part of the North Atlantic Ocean." &mdash Waldo, 1896, p. 239.
Place Names: Northern Hemisphere, Asia, �Europe, �North Americ
ISO Topic Categories: climatologyMeteorologyAtmosphere,
inlandWaters,
oceans
Keywords: Isobar Chart of the Northern Hemisphere in December, physical, �meteorological, �air pressure, kClimate, physical features, climatologyMeteorologyAtmosphere,
inlandWaters,
oceans, Unknown, December 15, 1882
Source: Frank Waldo, Elementary Meteorology (New York, New York: American Book Company, 1896) 240
Map Credit: Courtesy the private collection of Roy Winkelman |
|