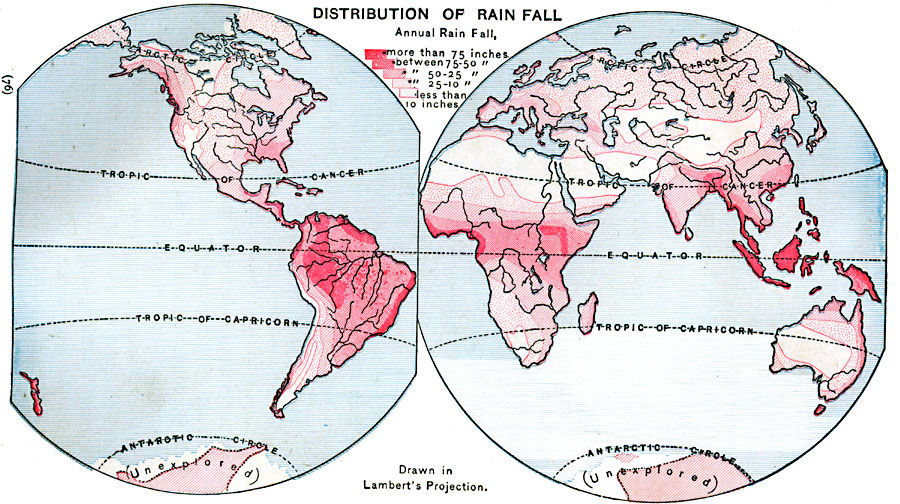
Description: A world map from 1909 on a Lambert's Projection, showing the distribution of mean annual rainfall. The map is color–coded to show mean rainfall ranging from more than 75 inches annually to less than 10 inches. "The reasons for the peculiar distribution [...] may be stated here (1) that the vapor taken up by the winds from the ocean is the ultimate source of rain–fall on the land; (2) that all sea winds reach the land nearly saturated with vapor; (3) that such winds in warm latitudes contain much more vapor than in cold latitudes; and (4) that the vapor in any wind is condensed into rain–fall only by the cooling of the air. This is usually achieved either by the rising of the air or by its entrance into colder latitudes." — Hinman, 1909, p. 77.
Place Names: A Complete Map of Globes and Multi-continent, Africa, �Asia, �Australia, �Europe, �North America, �South America, �Antarctic
ISO Topic Categories: inlandWaters,
location,
oceans,
climatologyMeteorologyAtmosphere
Keywords: World Annual Rainfall, physical, �meteorological, kClimate, kMapProjection, physical features, rainfall, inlandWaters,
location,
oceans,
climatologyMeteorologyAtmosphere, Unknown, 1909
Source: Russell Hinman, Eclectic Physical Geography (Cincinnati, Ohio: Houghton Mifflin Company, 1888) 76
Map Credit: Courtesy the private collection of Roy Winkelman |
|