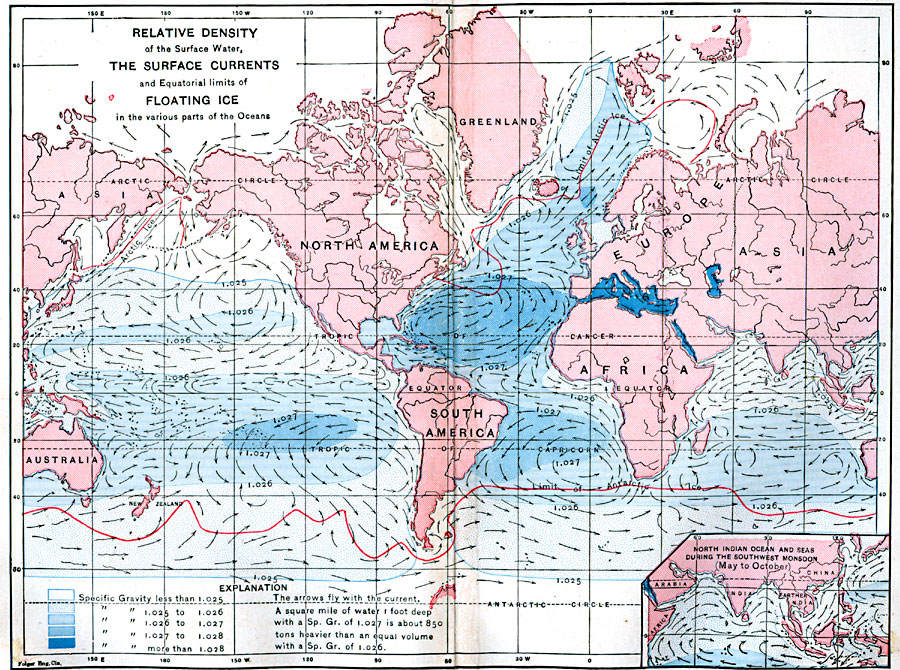
Description: A world map from 1888 showing the relative density and currents of oceanic surface waters across the globe, and the equatorial limits of floating ice in various parts of the oceans. This map illustrates the effects of salinity (measured in units of specific gravity) and water temperature (equatorial heat or polar cold) have on surface currents. This map is color-coded to show the specific gravities of surface waters ranging from less than 1.025 to over 1.028. Per the map notation: A square mile of water 1 foot deep with a specific gravity of 1.027 is about 850 tons heavier than an equal volume with a specific gravity of 1.026. The arrows on the map show the general direction of current flow. An inset map details the north Indian Ocean and seas during the southwest monsoons (May to October). "the varying temperature and saltness of the water in different parts of the sea give the surface water a tendency to move toward the equator in the torrid zone, and toward the poles in the temperate and frigid zones; and to the deeper water, in all zones, a general tendency to move toward the equator." — Hinman, 1888.
Place Names: A Complete Map of Globes and Multi-continent, Africa, �Asia, �Australia, �Europe, �North America, �South Americ
ISO Topic Categories: inlandWaters,
location,
oceans
Keywords: Surface Water Density and Currents, physical, �hydrological, �physical features, currents, inlandWaters,
location,
oceans, Unknown, 1888
Source: Russell Hinman, Eclectic Physical Geography (Cincinnati, Ohio: Houghton Mifflin Company, 1888) 138-139
Map Credit: Courtesy the private collection of Roy Winkelman |
|