Maps Site map
  Maps > United States > Industry
Site Map  

  Record   1   to   10  of   11

A collection of industrial production and manufacturing district maps in the United States for use in the K-12 classroom.
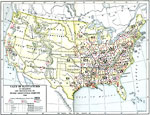
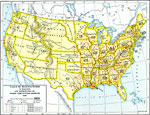
Value of Manufactures, 1860
A map of the United States showing the value of manufactures (in millions) and distribution of staple agricultural products in 1860. The map illustrates the disparity between the manufacturing–based economy in the northern region and slave&ndas...

Value of Manufactures (in Millions) and Distribution of Staple Agricultural Products, 1860
A map from 1860 showing the value of manufactures (in millions) and distribution of staple agricultural products, and is keyed to show the production of rice, cotton, corn, wheat, tobacco, and sugar....

The United States - Industrial Sections, 1897
A map exercise from 1897 of the contiguous 48 states showing the country divided into five industrial sections, the Northeastern Section, Northern Section, Southern Section, Plateau Section, and Pacific Section. Students are to list the states and th...

Industrial Sections, 1898
A map from 1898 of the United States showing the Industrial Sections of the contiguous 48 states at the time. "Owing largely to differences in surface structure, climate, and soil, the great productions of our country are confined more or less d...

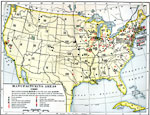
Manufacturing Areas, 1900
A map from 1907 of the United States showing the principal manufacturing areas in 1900. The star symbol in Ohio represents the mean center of manufacturing in the nation. Each symbol represents gross $25,000,000 or fraction more than $10,000,000. The...

Iron and Steel Manufacture, 1900
A map from 1900 of the United States showing the States where iron and steel manufacture is a principal industry. The map is keyed to show the mean annual production of manufactured goods given in dollars and the census of 1900....

United States Economic Regions, 1900
A map from 1912 of the United States showing the principal industries of the region. The map is color–coded to show the areas of fishing grounds, industrial centers, coal mining areas, petroleum fields, and iron ore fields. This map shows the c...

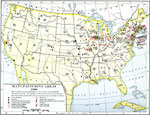
Manufacturing Areas , 1900
A map from 1920 of the United States showing the principal manufacturing areas in 1900. The star symbol in Ohio represents the mean center of manufacturing in the nation. Each symbol represents gross $25,000,000 or fraction more than $10,000,000. The...

United States Industrial Sections, 1901
A map from 1901 of the United States showing the product regions by separating the country into "(1) the Northeastern, or cloth–manufacturing section; (2) the Northern, or food–, iron–, and coal–producing, and manufactur...

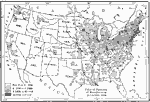
Manufacturing Districts in the United States, 1910
A map from 1910 of the United States showing the primary manufacturing districts at the time. The map is keyed to show areas where the averaged value of products of manufacture per square mile ranges from less than $1,000 per square mile to $100,000...

Next Last


  Maps > United States > Industry
Site Map  

Maps ETC is a part of the Educational Technology Clearinghouse
Produced by the Florida Center for Instructional Technology © 2009
College of Education, University of South Florida