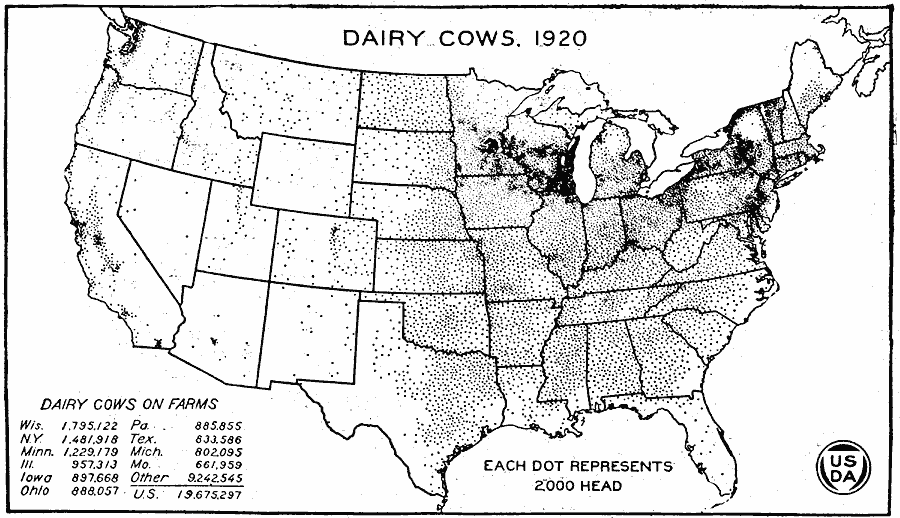
Description: A map of the United States from the U. S. Department of Agriculture (1922) showing the distribution of Milch Cows in the United States in 1920. "In number of cows Wisconsin took first rank among the dairy States in 1920; Minnesota was third, New York being second. Some of the eastern States continued to reduce. What may be called the dairy belt extends from the coast north of Maryland and north of the Corn Belt west to the semi–arid Great Plains. The eastern part of this belt suffers from competition with the West where feed is more abundant and cheaper." — United States Department of Agriculture Yearbook 1922, 1923.
Place Names: Agriculture, Wisconsin, New York, Minnesota, Illinois, Iowa, Ohio, Pennsylvania, Texas, Michigan, Missouri, �cattl
ISO Topic Categories: boundaries,
inlandWaters,
farming
Keywords: Milch Cow Distribution, physical, �political, �statistical, �milch cow distribution, milk cow, dairy cow, kAgriculture, physical features, country borders,
major political subdivisions, agriculture, boundaries,
inlandWaters,
farming, Unknown, 1920
Source: , United States Department of Agriculture Yearbook 1922 (Washington, DC: Government Printing Office, 1923) 301
Map Credit: Courtesy the private collection of Roy Winkelman |
|