|
|
|
| Maps > United States > Demographics |
A collection of historic population density and distribution maps of the United States for use in the K-12 classroom.
|
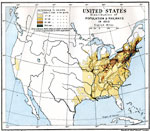
Distribution of Population,
1800 |
|
Distribution of Population,
1820 |
|
Distribution of Population,
1820 |
|
Distribution of Population,
1830 |
|
Population,
1840 |
|
Distribution of Population ,
1850 |
|
United States Population Density,
1850 |
|
Population Distribution,
1860 |
|
Population Distribution,
1870 |
|
Distribution of Population,
1880 |
| First | Previous | Next | Last |
| Maps > United States > Demographics |
Maps ETC is a part of the Educational Technology Clearinghouse
Produced by the Florida Center for Instructional Technology © 2009
College of Education, University of South Florida