Maps Site map
  Maps > United States > Agriculture
Site Map  

  Record   121   to   130  of   141

A collection of agricultural production and agricultural related maps in the United States for use in the K-12 classroom.

Rye Production in the United States, 1919
A map of the United States from the U. S. Department of Agriculture (1922) showing the average yield of rye production in 1919. Each dot represents 25,000 bushels. The total yield of rye for the United States in 1919 was 75,992,223 bushels....

Rice Production in the United States, 1919
A map of the United States from the U. S. Department of Agriculture (1922) showing the average yield of rice production in 1919. Each dot represents 5,000,000 pounds. The total yield of rice for the United States in 1919 was 981,414,222 pounds. This ...

Grain Sorghum Acreage, 1919
A map of the western United States from the U. S. Department of Agriculture (1922) showing grain sorghum acreage in the Southwest region in 1919. Each dot represents 5,000 acres of grain sorghum production....

Corn Acreage in the West, 1919
A map of the western United States from the U. S. Department of Agriculture (1922) showing corn acreage in the Southwest region of the United States in 1919. Each dot represents 5,000 acres of corn production....

Flaxseed production in the United States, 1919
A map of the United States from the U. S. Department of Agriculture (1922) showing the average yield of flaxseed production in 1919. Each dot represents 25,000 bushels. The total yield of flaxseed for the United States in 1919 was 6,653,200 bushels....

Buckwheat Production in the United States, 1919
A map of the United States from the U. S. Department of Agriculture (1922) showing the average yield of buckwheat production in 1919. Each dot represents 25,000 bushels. The total yield of buckwheat for the United States in 1919 was 12,690,384 bushel...

United States Production of Hogs, 1920
A map of the United States from the U. S. Department of Agriculture (1923) showing the numbers and location of hogs produced in the United States in 1920. "Between 1910 and 1920 the number of hogs continued to increase in the Dakotas, but decrea...

Pure Bred Hogs, 1920
A map of the United States from the U. S. Department of Agriculture (1922) showing the percentage of hogs on farms that were registered as pure bred as of January 1, 1920....

Milch Cow Distribution, 1920
A map of the United States from the U. S. Department of Agriculture (1922) showing the distribution of Milch Cows in the United States in 1920. "In number of cows Wisconsin took first rank among the dairy States in 1920; Minnesota was third, New...

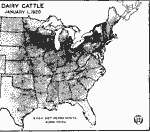
Dairy Cattle, 1920
A map of the United States from the U. S. Department of Agriculture (1922) showing the distribution of dairy cattle by state on January 1, 1920....

First Previous Next Last


  Maps > United States > Agriculture
Site Map  

Maps ETC is a part of the Educational Technology Clearinghouse
Produced by the Florida Center for Instructional Technology © 2009
College of Education, University of South Florida