Maps Site map
  Maps > United States > Agriculture
Site Map  

  Record   41   to   50  of   141

A collection of agricultural production and agricultural related maps in the United States for use in the K-12 classroom.

Barley Production in the US, 1889
A map of the United States from the U. S. Department of Agriculture (1922) showing the average yield of barley production in 1889. Each dot represents 100,000 bushels. The total yield of barley for the United States in 1889 was 78,332,976 bushels....

Rye Production in the United States, 1889
A map of the United States from the U. S. Department of Agriculture (1922) showing the average yield of rye production in 1889. Each dot represents 25,000 bushels. The total yield of rye for the United States in 1889 was 28,421,398 bushels....

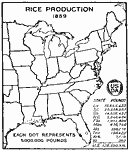
Rice Production in the United States, 1889
A map of the eastern United States from the U. S. Department of Agriculture (1922) showing the average yield of rice production in 1889. Each dot represents 5,000,000 pounds. The total yield of rice for the United States in 1889 was 128,590,934 pound...

Flaxseed production in the United States, 1889
A map of the United States from the U. S. Department of Agriculture (1922) showing the average yield of flaxseed production in 1889. Each dot represents 25,000 bushels. The total yield of flaxseed for the United States in 1889 was 10,250,410 bushels....

Milch Cow Distribution, 1890
A map of the United States from the U. S. Department of Agriculture (1922) showing the distribution of Milch Cows in the United States in 1890. "By 1890 Chicago had become the market center for the greatest dairy region of the United States. In ...

The United States - Cotton Region, 1897
A map from 1897 of the United States showing the region of cotton production in the southern states....

The United States - Wheat Region, 1897
A map from 1897 of the United States showing the region of potato production....

The United States - Potato Region, 1897
A map from 1897 of the United States showing the region of cotton production in the southern states....

Cotton Region of the United States, 1898
A map from 1898 of the United States showing the cotton region in the contiguous 48 states at the time. The map is keyed to show areas of moderate and heavy cotton production within the region....

Tobacco Regions, 1898
A map of the United States showing the tobacco regions in the contiguous 48 states as of 1898, keyed to show areas of moderate cultivation and heavy cultivation. "As much tobacco is raised in the United States as in all the rest of the world tog...

First Previous Next Last


  Maps > United States > Agriculture
Site Map  

Maps ETC is a part of the Educational Technology Clearinghouse
Produced by the Florida Center for Instructional Technology © 2009
College of Education, University of South Florida