|
|
|
| Maps > Globes and Multi-continent > Complete Maps |
A collection of world and multi-continent maps, including various projections, hemispheric maps, physical and political maps, early known world maps, climate maps, relief maps, ocean current maps, population density and distribution maps, vegetation maps, and economic/resource maps.
|
Locations of Hemp Cultivation,
1913 |
|
Pre-War World Oats Acreage,
1914 |
|
World Isothermal Lines in January,
1914 |
|
World Isothermal Lines in July,
1914 |
|
World Isobaric Lines in January,
1914 |
|
World Isobaric Lines in July,
1914 |
|
Pre-WWI World Barley Acreage,
1914 |
|
World Flax Acreage Pre-WWI,
1914 |
|
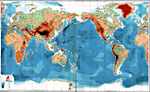
Bathy-Orographical Chart of the World,
1915 |
|
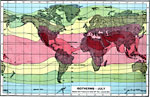
Isotherms - July,
1915 |
| First | Previous | Next | Last |
| Maps > Globes and Multi-continent > Complete Maps |
Maps ETC is a part of the Educational Technology Clearinghouse
Produced by the Florida Center for Instructional Technology © 2009
College of Education, University of South Florida