Record
261 to
270 of
316
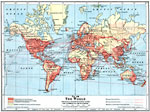
A collection of world and multi-continent maps, including various projections, hemispheric maps, physical and political maps, early known world maps, climate maps, relief maps, ocean current maps, population density and distribution maps, vegetation maps, and economic/resource maps.
|
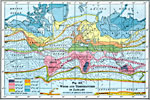
Global Winds and Temperatures in January,
1916
A 1916 world map showing mean global winds and temperatures during the month of January. This map is color–coded to show mean January temperatures in degrees Fahrenheit for areas of land and along isotherms of the oceans, ranging from over 90&d...
|
|
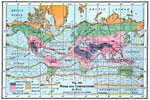
Global Winds and Temperatures in July,
1916
A 1916 world map showing mean global winds and temperatures during the month of July. This map is color–coded to show mean July temperatures in degrees Fahrenheit for areas of land and along isotherms of the oceans, ranging from over 90° in...
|
|
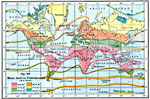
Global Mean Annual Rainfall,
1916
A world map from 1916 showing mean annual rainfall across the earth. The map is shade–coded to show regions where there is little or no rainfall in light stippling, areas of lighter rainfall in light gray, moderate to heavy rainfall in dark gra...
|
|
Winds on the Earth's Surface,
1916
A map from 1916 showing the winds on the earth's surface, and a vertical section of the atmosphere showing circulation. "Since the earth's surface is warmer in the equatorial regions than it is in the temperate and polar regions, the air is expa...
|
|
Mean Annual Temperatures,
1916
A map from 1916 showing the mean annual temperatures of the world. This map is color–coded to show areas (land) and isotherms (oceans) ranging from an annual average temperature below 0° to over 80° Fahrenheit. The heat equator is shown...
|
|
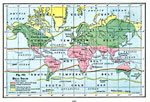
Heat Belts of the World,
1916
A world map from 1916 showing the Earth's heat belts. This map is color-coded to show the Hot Belt where temperatures are above 68° mean annual temperature, Temperate Belt, and Cold Caps, where every month averages below 50deg;. The map also show...
|
|
Wheat Production,
1916
A world map from 1916 showing the principal wheat–producing regions of the world at the time, showing areas of production in hatchures, with the regions of heaviest production in black. Based on five–year averages; "World’s annual pr...
|
|
Corn Production,
1916
A world map from 1916 showing the principal corn–producing regions of the world at the time. Based on five–year averages; "World’s annual production, 3,880,000,000 bushels. Leading corn–growing countries, with percentages of th...
|
|
Rice Production,
1916
A world map from 1916 showing the principal rice–producing regions of the world at the time. Based on five–year averages; "World’s annual production, 155,000,000,000 pounds. Leading rice–growing countries, with percentage of wo...
|
Maps ETC is a part of the Educational Technology Clearinghouse
Produced by the Florida Center for Instructional Technology © 2009
College of Education, University of South Florida