Record
81 to
90 of
316
A collection of world and multi-continent maps, including various projections, hemispheric maps, physical and political maps, early known world maps, climate maps, relief maps, ocean current maps, population density and distribution maps, vegetation maps, and economic/resource maps.
|
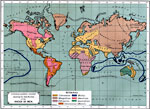
Average Global Temperatures,
1896
A map of the Earth from 1896, showing averaged annual global temperatures in degrees Fahrenheit, and delineated by isotherms. The map is color–coded to show climate zones ranging from below zero degrees Fahrenheit to a mean 80 degrees Fahrenhei...
|
|
January Temperature,
1896
An isothermal chart of the world from 1896 showing typical temperature patterns for the month of January. This map is color–coded to show progressive temperature regions, ranging from below –30° Fahrenheit (blue) to above 90° Fahr...
|
|
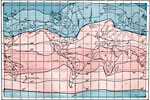
Isabnormal January Temperatures,
1896
A world map from 1896 showing the global isabnormal temperatures for January. "The irregular distribution of temperatures over the earth is best shown by considering the difference between the average temperature of each parallel and the actual ...
|
|
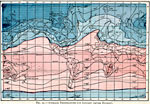
Isabnormal July Temperatures,
1896
A world map from 1896 showing the global isabnormal temperatures for July. "The irregular distribution of temperatures over the earth is best shown by considering the difference between the average temperature of each parallel and the actual tem...
|
|
Global Annual Temperature Range,
1896
A map of the Earth from 1896, showing the global annual range of average monthly temperature from cool months to warm months. Isotherms delineate areas of temperature fluctuations, where, for example, in central Australia, there is a 30 degree differ...
|
|
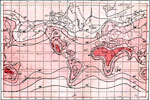
Maximum Mean Annual Temperatures,
1896
A world map from 1896 showing the average maximum air temperatures for the year over the whole earth. Isotherms are drawn for each 9° Fahrenheit. "This chart shows that the maximum temperatures have a quite regular distribution on the oceans...
|
|
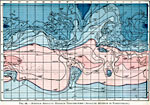
Minimum Mean Annual Temperatures,
1896
A world map from 1896 showing the average minimum air temperatures for the year over the whole earth. Isotherms are drawn for each 9° Fahrenheit. "This chart shows very strongly marked regional characteristics. On the Pacific, Atlantic, and ...
|
|
Temperature Oscillation,
1896
A world map from 1896 showing global average annual extreme temperature oscillation, with absolute oscillation in parentheses. "The average extreme oscillation or amplitude of the temperature during the year, increases with the latitude and towa...
|
|
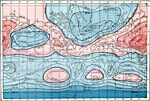
January Isobars,
1896
A world map from 1896 showing typical global isobars and winds during January. This map is color–coded to show the areas of high barometric pressure in pinks, and areas of low barometric pressure in blues. Barometric pressures are shown on the ...
|
Maps ETC is a part of the Educational Technology Clearinghouse
Produced by the Florida Center for Instructional Technology © 2009
College of Education, University of South Florida