| Maps > United States > Complete Maps |
 |
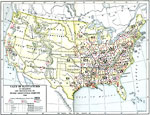
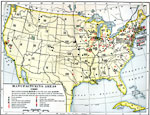
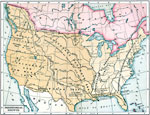
The United States - Cities and Towns, Map of United States showing the relative population. |
 |
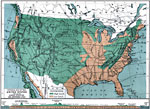
The United States - Industrial Sections, Map of United States showing the industrial sections. |
 |
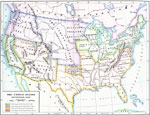
Swamp lands of the United States, A map showing the swamp lands of the United States with degrees of swampiness shown in two shadings. |
 |
Drainage on the Laurentian Plateau, A map showing the details of drainage in a limited portion of the Laurentian Plateau. |
 |
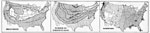
Average Temperature in January, A map showing the average surface temperatures in the United States during the month of January. |
 |
Average Temperature in July, A map showing the average surface temperatures in the United States during the month of July. |
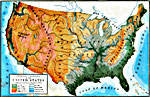 |
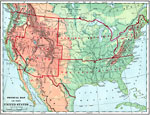
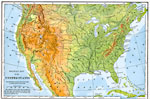
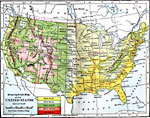
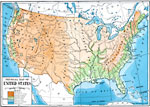
Physical Features of the United States, A map showing the physical features of the United States. |
 |
North America (Physical), Map showing physical features of North America. |
 |
Normal Surface Temperatures for July, July A map showing the normal surface temperatures for the month of July in the United States. |
 |
Normal Surface Temperature for January, January A map showing the normal surface temperatures for Janaury in the United States. |
 |
Killing Frost, A map of the average date of the last killing frost in Autumn. |
 |
First Killing Frost of Spring, A map showing the average dates of first killing frost in Spring. |
 |
Mean Annual Precipitation in the United States, A map showing the mean annual precipitation i nthe United STates reduced to inches of rainfall. |
 |
Absolute Minimum Temperatures, A map showing the absolute minimum temperatures in the United States. |
 |
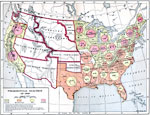
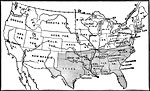
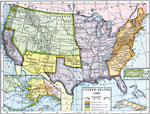
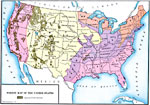
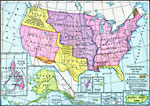
Territorial Growth, Map showing Territorial Growth of the United States. |
 |
Average Humidity, A map showing the average annual humidity of the air in the United States. |
 |
Rainfall Percentage, A map showing the percentage of annual rainfall received in the six warmer months, April to September inclusive. |
 |
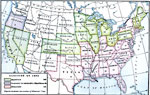
Forest Regions of the United States, A map showing the forest regions of the United States. |
 |
United States Cities and Towns, Cities and towns in the United States. |
 |
Southern Limit of Glaciation, A map showing the centers of ice accumulation, the position of the Driftless Area, and the southern limit of glaciation. |
 |
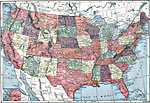
The United States, Map of United States showing population density. |
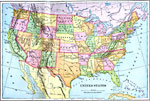 |
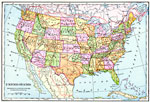
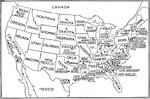
The United States, Map of United States showing state borders, used for teaching pronunciations of state names. |
 |
The United States - Cotton Region, Map of United States showing the region where cotton is grown. |
 |
The United States - Wheat Region, Map of United States showing the region where wheat is grown. |
 |
The United States - Potato Region, Map of United States showing the region where potatoes are grown. |
 |
The United States - Forest Regions, Map of United States showing the regions that have forests. |
 |
The United States - Coal Fields, Map of United States showing the regions that have coal mines. |
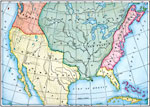 |
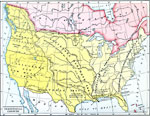
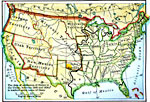
Claims in North America in 1760, 1760 A map showing the claims of French, England, and Spain upon the central part of North America in 1760. |
 |
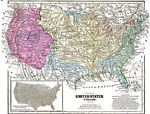
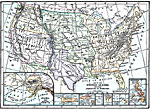
Old Claims in the United States, 1763 A map showing the present territory of the United States, and parts claimed by European nations before 1763. |
 |
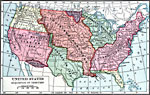
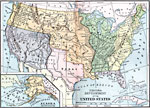
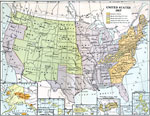
The Growth of the United States, 1776-1867 Map showing growth of the United States from 1776-1861. Inset map of Alaska. |
 |
The United States of America, 1783-1853 A map of the continental United States. |
 |
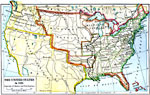
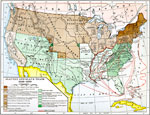
Acquisitions of US Territory, 1783-1853 A map showing US territorial expansion from 1783 to 1853. |
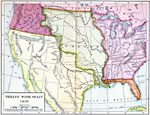 |
Treaty with Spain, 1819, 1819 A map showing the treaty with Spain in 1819. |
 |
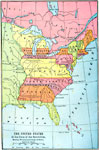
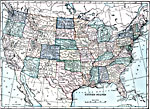
The United States in 1821, 1821 Map showing the United States in 1821, listing capitals of states and territories. |
 |
The result of the Missouri Compromise, 1821 Map showing the United States in 1821, listing capitals of states and territories. |
 |
The United States in 1840, 1821 Map showing the United States in 1840, listing states' date of admission to the Union. |
 |
The United States in 1850, 1821 Map showing the United States in 1850, listing states' date of admission to the Union. |
 |
Slavery and Slave Trade 1830-1850, 1830-1850 Map showing Slavery and Slave Trade 1830-1850. |
 |
Slavery and the Slave Trade, 1830-1850 A map showing slavery and the slave trade in the United States, from 1830-1850. |
 |
Value of Dairy Products, 1839, 1839 Map showing the dollar value of dairy products in 1839 by state. "The value of dairy products is the only measure of dairying available for 1839. The most important centers of production were in the vicinity of Boston, western Connecticut, vicinity of New York City, in the Mohawk Valley of central New York, and in the vicinity of Philadelphia on both sides of the Delaware River."—United States Department of Agriculture Yearbook 1922, 1923 |
 |
United States Production of Hogs, 1840 Map showing the numbers and location of hogs produced in the United States in 1840. "The important centers of hog production in 1840 were in the earliest settled corn-growing regions west of the Allegheny Mountains. Hogs were driven from these regions to the Atlantic coast and to the Cotton Belt to market."— United States Department of Agriculture Yearbook, 1923 |
 |
Principal Routes of Trade and Migration 1840-1850, 1840-1850 Map showing Principal Routes of Trade and Migration 1840-1850. |
 |
Cheese Made on Farms, 1849, 1849 Map showing cheese made on farms by state in 1849. "Western New England, central and western New York and northeastern Ohio were the important cheese producing regions in 1849. Cheese production was the pioneer form of commercial dairying in the cooler climates. Dairies near large cities sold milk or butter."—United States Department of Agriculture Yearbook 1922, 1923 |
 |
Milch Cow Distribution, 1850, 1850 Map showing the distribution of Milch Cows in the United States in 1850. "In 1850 cows were numerous in southern New England, Vermont, southern and central New York, in northern New Jersey, in southeastern Pennsylvania, and in northeastern Ohio. Outside of these areas they were quite evenly distributed over the settled part of the United States."—United States Department of Agriculture Yearbook 1922, 1923 |
 |
Distribution of Population in 1850, 1850 A map showing the population distribution of the United States in 1850. |
 |
United States in 1850, 1850 A map showing the United States in 1850. |
 |
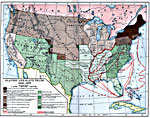
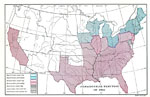
Results upon slavery of the Compromise of 1850, 1850 Map showing the results upon slavery of the Compromise of 1850. |
 |
Progress of Emancipation, 1850-1865, 1850-1865 A map showing the progress of emancipation between 1850 and 1865. |
 |
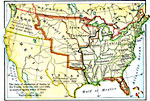
United States Acquisition of Territory, 1853 A map showing the acquisition of territory by the United States. |
 |
Test-vote on the Kansas-Nebraska Bill, 1854 A map showing the results of the test-vote on the Kansas-Nebraska Bill in the House of Representatives. |
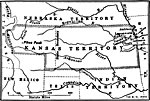 |
Scene of the struggle in Kansas, 1854 Map showing the scene of the struggle regarding slavery in Kansas. |
 |
Presidential Election of 1856, 1856 A map showing the presidential election of 1856 |
 |
Cheese Made on Farms, 1859, 1859 Map showing cheese made on farms by state in 1859. "Some cheese was reported from California and Oregon for 1859. Minnesota was another new State to report about 200,000 pounds of cheese. Increases may be noted in Wisconsin, Iowa, and Michigan, on the other hand, reductions in New England."—United States Department of Agriculture Yearbook 1922, 1923 |
 |
United States Production of Hogs, 1860 Map showing the numbers and location of hogs produced in the United States in 1860. "In the Mississippi Valley production continued to increase between 1850 and 1860 and expanded westward into Iowa, Nebraska, and Kansas. The areas of densest production were not far from Cincinnati, which was still the great packing center. Hogs had now become numerous in California."— United States Department of Agriculture Yearbook, 1923 |
 |
Value of Manufactures in 1860, 1860 A map showing the value of manufactures (in millions) and distribution of staple agricultural products in the United States, in 1860. |
 |
Presidential Election of 1860, 1860 A map showing the presidential election of 1860. |
 |
Map of the United States in 1860, 1860 Map of the United States in 1860 showing the states that seceded to form the Confederate States.— A Bird's-Eye View of our Civil War, 1897 |
 |
The United States in 1861, 1861 Map showing the United States in 1861, listing states' date of admission to the Union. |
 |
Charleston Harbor, 1861 Map showing Charleston Harbor, South Carolina in 1861. |
 |
Territory held by the Confederates at the close of 1861, 1861 Map showing territory held by the Confederates at the close of 1861. |
 |
Territory held by the Confederates at the close of 1862, 1862 Map showing territory held by the Confederates at the close of 1862. |
 |
Territory held by the Confederates at the close of 1863, 1863 Map showing territory held by the Confederates at the close of 1863. |
 |
Territory held by the Confederates at the close of 1864, 1864 Map showing territory held by the Confederates at the close of 1864. |
 |
Congressional Election of 1866, 1866 A map showing the results of the 1866 Congressional election. |
 |
, 1867 A map showing the territorial development of the United States |
 |
Milk Sold from Farms, 1869, 1869 Map showing the number of gallons of milk sold from farms in 1869 by state. "Probably the greater part of the milk sold from farms in 1869 was whole milk for cities. Some of it went to noncooperative cheese factories. Compare with maps of cheese made on farms 1869."—United States Department of Agriculture Yearbook 1922, 1923 |
 |
Cheese Made on Farms, 1869, 1869 Map showing cheese made on farms by state in 1869. "The farm production of cheese in 1869 was only half that of 1859. Cheese production had increased, but two-thirds of the product was prepared in factories which are not represented on this map. Farm production continued to be important in western New England, central New York and northeastern Ohio."—United States Department of Agriculture Yearbook 1922, 1923 |
 |
The United States in 1870, 1870 A map of the United States in 1870. |
 |
Population Distribution in 1870, 1870 A map showing the distribution of population in the United States in 1870. |
 |
Election of 1876, 1876 A map showing the electoral results of 1876. |
 |
Milk Sold from Farms, 1879, 1879 Map showing the number of gallons of milk sold from farms in 1879 by state. "The milk supply zones about the larger cities expanded between 1869 and 1879. Note the Philadelphia, New York, Boston, and Chicago areas. Cleveland and Buffalo took some of the milk from northeastern Ohio and western New York, but most of it went to cheese factories."—United States Department of Agriculture Yearbook 1922, 1923 |
 |
Cheese Made on Farms, 1879, 1879 Map showing cheese made on farms by state in 1879. "By 1879 cheese production on the farm had dwindled to one-ninth of the total production. The old centers of farm production, however, can still be recognized. A dot appears for the first time in Nebraska, also in the Red River Valley of Minnesota."—United States Department of Agriculture Yearbook 1922, 1923 |
 |
United States Production of Hogs, 1880 Map showing the numbers and location of hogs produced in the United States in 1880. "The center of greatest production had shifted by 1880 to western Illinois, eastern and southern Iowa, and northwestern Missouri. The present Corn Belt area was nearly all occupied by hogs. Production in the East continued to decline."—United States Department of Agriculture Yearbook, 1923 |
 |
Milch Cow Distribution, 1880, 1880 Map showing the distribution of Milch Cows in the United States in 1880. "Between 1870 and 1880 the number of cows increased nearly 50 per cent. The greatest increases were in Iowa, Kansas, Illinois, Wisconsin, and Minnesota. By 1880 nearly all of the States had recovered from the Civil War depression in number of cows. The westward movement had reached the semi-arid Great Plains."—United States Department of Agriculture Yearbook 1922, 1923 |
 |
Distribution of Population in 1880, 1880 A map showing the distribution of population in the United States in 1890. |
 |
Presidential Election of 1884, 1884 A map showing the rseults of the presidential election of 1884. |
 |
Cheese Made on Farms, 1889, 1889 Map showing cheese made on farms by state in 1889. "North Dakota, Idaho, and Utah each reported about 200,000 pounds of cheese for 1889. Kansas and Nebraska doubled their farm production since 1879, and Iowa increased its production slightly. Elsewhere farm cheese production generally continued to decrease."—United States Department of Agriculture Yearbook 1922, 1923 |
 |
Milch Cow Distribution, 1890, 1890 Map showing the distribution of Milch Cows in the United States in 1890. "By 1890 Chicago had become the market center for the greatest dairy region of the United States. In number of cows Iowa ranked first, New York was a close second, and Illinois ranked third. Dairying had almost entirely displaced wheat growing in southern Wisconsin and northern Iowa and was beginning to take the place of wheat on farms in southern Minnesota."—United States Department of Agriculture Yearbook 1922, 1923 |
 |
The United States in 1890, 1890 A map of the United States in 1890, showing states, cities, and railroads. |
 |
Distribution of Population in 1890, 1890 A map of the United States showing the distribution of population in 1890. |
 |
House Vote on McKinley Tariff, 1890 A map showing the results of the House vote on the McKinley Tariff Bill, 1890. |
 |
Physical Map of the United States showing the Surface Structure and Isothermal Lines, 1891 Map of the United States showing the Surface Structure and Isothermal Lines. |
 |
Weather Map, showing condition of the Weather on a certain day in April, 1891 Weather map of the United States showing the showing condition of the Weather on a certain day in April. |
 |
Map showing condition of the Weather on the following day, 1891 Weather map of the United States showing the showing condition of the Weather on the following day in April. |
 |
House Vote on the Wilson Tariff, 1894 A map showing the results of the House vote on the Wilson Tariff Bill, August 13, 1894. |
 |
Milk Sold from Farms, 1899, 1899 Map showing the number of gallons of milk sold from farms in 1899 by state. "The whole milk supply zones of some of the great cities had spread out over large areas by 1899. Boston drew milk from most of New England. New York City drew milk from central and eastern New York, Vermont, and western Massachusetts and Connecticut. In the East most of the milk sold went to the cities, whereas in the West much of it went to cheese and butter factories and some to condesaries."—United States Department of Agriculture Yearbook 1922, 1923 |
 |
Butter Sold From Farms, 1899, 1899 Map showing the amount of butter sold from farms (in pounds) in 1899 by state. "This map marks well the areas of commercial dairying. In the South as a rule cows were kept only to supply home needs. Much of the butter and all of the cheese consumed in the South was produced in the North. The farm production of butter for market in 1899 was in the hay and pasture region of the northeastern and Lake States, with a less dense production in the Corn Belt."—United States Department of Agriculture Yearbook 1922, 1923 |
 |
Physical Map of the United States, 1899 Map of United States in color. |
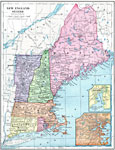 |
New England States, 1899 Map of New England States in color. |
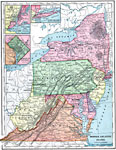 |
Middle Atlantic States, 1899 Map of Middle Atlantic States in color. Cities with populations of over 100,000 are underscored. |
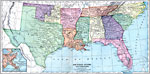 |
Southern States and Territories, 1899 Map of Southern States and Territories in color. Cities with populations of over 50,000 are underscored. |
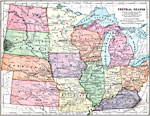 |
Central States, 1899 Map of Central States in color. Cities with populations of over 100,000 are underscored. |
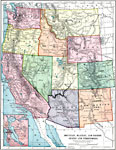 |
Mountain, Plateau, and Pacific States and Territories, 1899 Map of Mountain, Plateau, and Pacific States and Territories in color. Cities with populations of over 50,000 are underscored. |
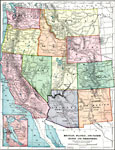 |
Mountain, Plateau, and Pacific States and Territories, 1899 Map of Mountain, Plateau, and Pacific States and Territories in color. Cities with populations of over 50,000 are underscored. |
 |
United States Production of Hogs, 1900 Map showing the numbers and location of hogs produced in the United States in 1900. "The most notable increases between 1880 and 1900 were made in Nebraska and Kansas and along the northern border of the Corn Belt in Wisconsin, northern Iowa, southern Minnesota, and southeastern South Dakota. Oklahoma and Indian Territory had been opened to settlement and many hogs were being produced in these new States."—United States Department of Agriculture Yearbook, 1923 |
 |
Milch Cow Distribution, 1900, 1900 Map showing the distribution of Milch Cows in the United States in 1900. "The census enumerated separately the cows kept principally for milk for the first time in 1900.The exclusion of cows kept principally for raising calves reduced the number in some of the principal beef-producing States. The greatest increase in the decade 1890-1900 was made in Wisconsin. In some of the eastern States the number of cows had begun to decline."—United States Department of Agriculture Yearbook 1922, 1923 |
 |
Population in United States, 1900 A map showing the distribution of population in the United States, 1900. |
 |
The United States in 1900, 1900 A map of the United States in 1900. |
 |
Presidential Election of 1900, 1900 A map showing the results of the presidential election of 1900. |
 |
Distribution of Ethnicities in 1900, 1900 A map showing the distribution of ethnicities in the United States in 1900. |
 |
Manufacturing Areas in 1900, 1900 A map of the United States in 1900, showing manufacturing areas. |
 |
Physical Map of United States, 1901 Physical map of the United States. |
 |
United States Climate, 1901 Heat belts, number of freezing days, and rainfall in the United States. |
 |
Cyclone, 1901 Map showing winds in a cyclone over the United States. |
 |
United States, 1901 Map of the United States. |
 |
Density of Population in US, 1901 Map showing density of population in the United States. |
 |
United States Cotton Region, 1901 Cotton growing region in the United States. |
 |
United States Wheat Regions, 1901 Wheat growing regions in the United States. |
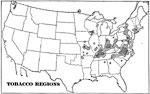 |
United States Tobacco Regions, 1901 Tobacco growing regions in the United States. |
 |
United States Forest Regions, 1901 Forest regions in the United States. |
 |
United States Coal Fields, 1901 Coal fields in the United States. |
 |
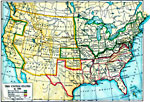
United States Railroads, 1901 Railroads in the United States. |
 |
United States Standard Time Belts, 1901 Time zones in the United States. |
 |
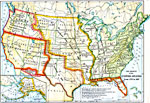
United States Industrial Sections, 1901 Map of the United States separated into "(1) the Northeastern, or cloth-manufacturing section; (2) the Northern, or food-, iron-, and coal-producing, and manufacturing section; (4) the Plateau, or grazing and gold- and silver-mining section; and (5) the Pacific, or Western food- and gold-producing section."—Natural Advanced Geography, 1901 |
 |
Presidential Election of 1904, 1904 |
 |
Expansion Map of the United States, 1904 Map shows territories and dates purchased. |
 |
Chestnut Blight 1904-1922, 1904-1922 Map showing the range of chestnut blight from 1904 to 1922. |
 |
Orographical Map of the United States, 1906 Map of the United States in 1906. |
 |
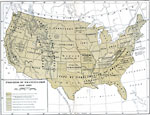
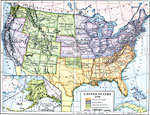
Territorial Growth of the United States, 1907 A map showing the territorial growth of the United States. |
 |
Milk Sold from Farms, 1909, 1909 Map showing the number of gallons of milk sold from farms in 1909 by state. "On this map groups of dots generally locate large cities. In the larger black areas milk is also sold to condensaries, cheese and butter factories. Railroads carried milk to New York City from the Canadian border on the north and from near Buffalo on the west."—United States Department of Agriculture Yearbook 1922, 1923 |
 |
Cheese Made on Farms, 1909, 1909 Map showing cheese made on farms by state in 1909. "Farm cheese production had almost completely disappeared from most States by 1909. It is interesting to note that many farmers of California continued to make cheese. Farmers along the northern border of Pennsylvania seem to be reviving the industry."—United States Department of Agriculture Yearbook 1922, 1923 |
 |
Milch Cow Distribution, 1910, 1910 Map showing the distribution of Milch Cows in the United States in 1910. "A marked increase in dairy cows may be noted in the Pacific Coast States. Wisconsin continued to increase the number of cows taking second place. Minnesota dairying was also developing rapidly. Cows were decreasing in southern New England. The figures for 1910 are not strictly comparable with those for 1900, since the 1910 census included younger cows than were included in 1900."—United States Department of Agriculture Yearbook 1922, 1923 |
 |
Physical Map of the United States, 1910 A physical map of the United States of America. |
 |
Relief Map of the United States, 1910 A relief map of the United States. |
 |
Population Density in 1910, 1910 A map showing population density in the United States in 1910. |
 |
Cities in the United States, 1910 A map showing the distribution of cities in the United States, around 1910. |
 |
Corn Production in the United States, 1910 A map showing the regions of corn production in the United States. |
 |
Wheat Regions of the United States, 1910 A map showing the wheat regions of the United States. |
 |
Tobacco Production in 1910, 1910 A map showing the tobacco-producing states in 1910. |
 |
Fruit-Growing Regions in the United States, 1910 A map showing the leading fruit-growing regions of the United States. |
 |
Forest Map of the United States, 1910 A forest map of the United States. |
 |
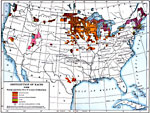
Distribution of Fish in North America, 1910 A map showing the distribution of fish in North America. |
 |
Mineral Regions of the United States, 1910 A map showing the regions of the United States. |
 |
Manufacturing Districts in the United States, 1910 A map showing the leading manufacturing districts in the United States. |
 |
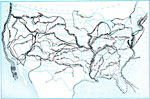
Interior Water Routes of the United States, 1910 A map to show the navigable interior water routes of the United States in 1910. |
 |
Railroads in North America, 1910 A map showing the railroads of the United States and connecting steamship lines. |
 |
US Territorial Acquisitions, 1910 A map to show when and how the United States obtained its territory. |
 |
Standard Time in the United States, 1910 A map showing the standard time belts of the United States. |
 |
Mean Annual Rainfall of the United States, 1910 A map showing the mean annual rainfall in the United States around 1910. |
 |
Winter Weather Map of the United States, 1910 A weather map of the United States on a winter's day. The lines are lines of equal air pressure, the lower the figure, the lighter the air. The pressure is determined by an instrument called the barometer. |
 |
Weather Weather Map of the United States, 1910 A weather map of the United States on a winter day. |
 |
Isothermal Chart of the US for January, 1910 An isothermal chart of the United States for January. |
 |
Isothermal chart of the US for July, 1910 An isothermal chart of the United States for July. |
 |
Territorial Growth of the United States, 1911 |
 |
The United States at the Close of the Revolution, Showing Land Claims of States, 1911 |
 |
Bunker Hill and Boston, 1911 |
 |
Valley Forge, Philadelphia, and Brandywine, 1911 |
 |
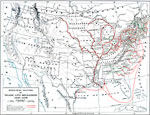
Westward March of the Great Pioneers and Explorers, 1911 Map shows land routes taken by famous explorers across North America. |
 |
Presidential Election of 1912, 1912 A map showing the presidential election results of 1912. |
 |
Map of the United States, 1913 A 1913 map of |
 |
Vote on Underwood Tariff, 1913 A map showing the vote in the House of Representatives on the Underwood Tariff in 1913. |
 |
Army Camps in the United States, 1914-1919 A map showing Army camps in the United States during World War 1. |
 |
Crop Growing Season, 1916 A 1916 map showing the average length of the crop-growing season in the United States. |
 |
Average Annual Rainfall, 1916 A 1916 map showing the average annual rainfall in the United States. |
 |
Railroads of the United States, 1916 A map showing the railroad networks in the United States in 1916. |
 |
Coal Fields of the United States, 1916 A map showing the coal fields of the United States in 1916. |
 |
Petroleum and Natural Gas Fields, 1916 A map of petroleum and natural gas fields in the United States in 1916. |
 |
Tobacco Producing Regions, 1916 A map of the tobacco-producing regions of the United States in 1916. |
 |
Flood Stations, 1916 A map showing the cities where the government maintained flood stations in 1916. |
 |
Sugarcane and Sugarbeet Production, 1916 A map of the United States, showing the production of sugar cane and sugar beets in 1916. |
 |
Wheat Production in the United States, 1916, 1916 A map of the wheat producing region of the United States in 1916. |
 |
Corn-producing Regions of the United States, 1916 A map showing the corn producing regions of the United States in 1916. |
 |
Swine Production, 1916, 1916 A map showing the swine producing regions of the United States in 1916. |
 |
Distribution of Cattle, 1916 A map showing the distribution of cows throughout the United States in 1916. |
 |
Distribution of Dairy Cows, 1916, 1916 A 1916 map of the United States showing the distribution of |
 |
National Forests and Parks, 1916 A 1916 map showing the location of forests and national parks in the United States. |
 |
Distribution of Sheep, 1916 A map showing the distribution of sheep in the United States. |
 |
Receipts of Hogs at Public Stockyards, 1916-1921 Map showing 21 largest swine markets ranked by annual receipts of hogs at public stockyards from 1916-1921. |
 |
Live Stock Loadings by States of Origin, 1918 Map showing the number of livestock loadings by state of origin in 1918. "In 1918 Iowa led in number of hogs loaded, with 144,105 cars; Illinois was second with 85,162 cars; Nebraska third with 61,489 cars; Indiana fourth with 46,362 cars, and Missouri fifth with 45,860 cars. Iowa loaded more than 25 per cent of all the hogs shipped during that year, whereas Missouri which was the fifth, loaded 8 per cent of the total."—United States Department of Agriculture Yearbook 1922, 1923 |
 |
Hogs Slaughtered on Farms, 1919 Map showing the number of hogs slaughtered on farms in 1919. |
 |
Milk Sold from Farms, 1919, 1919 Map showing the number of gallons of milk sold from farms in 1919 by state. "The amount of milk sold from farms, as in 1899 and 1909, is concentrated north of the Ohio and east of the Mississippi rivers. The major portion of the whole milk sold from farms is for direct urban consumption or for manufacture in cheese factories and condensaries."—United States Department of Agriculture Yearbook 1922, 1923 |
 |
Value of Dairy Products, 1919, 1919 Map showing the dollar value of dairy products in 1919 by state. "This map presents a striking contrast to the map for 1839. The value of the dairy products of the Rocky Mountain States in 1919 was greater than that of the United States in 1839. Prices were much inflated in 1919, $50,000 being equivalent to about $28,400 in 1839, which makes the difference appear greater than it actually is. The following maps will show steps in the changes between 1839 and 1919."—United States Department of Agriculture Yearbook 1922, 1923 |
 |
Butter Made on Farms, 1919, 1919 A map showing butter production on farms by state in 1919. |
 |
Receipts from Sale of Dairy Products, 1919 A map showing the receipts from the sale of dairy products in 1919 by state. |
 |
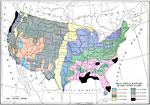
Legnuminous Hay Production, 1919, 1919 A map showing leguminous hay production in 1919. "Leguminous hays are splendid feed for dairy animals, and where they can be grown successfully are rpeplacing other hays. West of the Missouri River the leguminous hay is almost wholly alfalfa, east of the Missouri and north of the Cotton Belt it is mostly timothy and clover mixed and clover alone. Clover includes red, alsike, and crimson clover and several other legumes of less importance. The scattered dots in the Cotton Belt represent mostly cowpeas and soybeans cut for hay, and lespedeza."—United States Department of Agriculture Yearbook 1922, 1923 |
 |
Tobacco Production, 1919, 1919 A map showing centers of production of tobacco in the United States in 1919. |
 |
Forest Planting Regions in the United States, 1919 A map showing forest planting regions of the United States. The unshaded areas are treeless except along the streams. |
 |
United States in 1919, 1919 A map showing the United States and its territories in 1919. |
 |
The Presidential Election of 1916, 1919 A map showing the presidential election of 1916. |
 |
The United States, 1919 A map showing the continental United States in 1919. |
 |
Territorial Gains of the United States, 1919 A map showing the territorial gains of the United States up to 1919. |
 |
Increasing Distance from Lumber Producers to Lumber Consumers, 1920 Map showing the increasing distance lumber had to travel to go from the production areas in the South and West to the consumption areas in the East. |
 |
United States Production of Hogs, 1920 Map showing the numbers and location of hogs produced in the United States in 1920. "Between 1910 and 1920 the number of hogs continued to increase in the Dakotas, but decreased notably in Kansas and Oklahoma, where war-time prices for wheat had caused it to supplant much of corn. In the western States, especially California, the number had increased; also in Alabama, Georgia, and the Carolinas."—United States Department of Agriculture Yearbook, 1923 |
 |
Milch Cow Distribution, 1920, 1920 Map showing the distribution of Milch Cows in the United States in 1920. "In number of cows Wisconsin took first rank among the dairy States in 1920; Minnesota was third, New York being second. Some of the eastern States continued to reduce. What may be called the dairy belt extends from the coast north of Maryland and north of the Corn Belt west to the semi-arid Great Plains. The eastern part of this belt suffers from competition with the West where feed is more abundant and cheaper."—United States Department of Agriculture Yearbook 1922, 1923 |
 |
Average Number of Dairy Cows per Farm, 1920 A map showing the average number of dairy cows per farm by state in 1920. |
 |
Pure Bred Dairy Bulls, 1920, 1920 A map showing the percentage of bulls per state that were pure bred dairy bulls in 1920. |
 |
United States, 1920 The United States of America. |
 |
Pure Bred Hogs, January 1, 1920 Map showing the percentage of hogs on farms that were registered as pure bred as of January 1, 1920. |
 |
Dairy Cattle, January 1, 1920 A map showing the distribution of dairy cattle by state on January 1, 1920. |
 |
Pure Bred Dairy Cattle, 1920, January 1, 1920 A map showing the number of pure bred dairy cattle in each state on January 1, 1920. |
 |
Number of Pure Bred Dairy Cattle by Breeds and States, January 1, 1920 A map showing the number of pure bred dairy cattle by breeds and states on January 1, 1920. |
 |
Cheese Made in Factories, 1921, 1921 Map showing factory-produced cheese production by state in 1921. "Practically all the cheese is now made in factories, only 6,000,000 pounds in 1919, or less than 2 per cent of the total production of the United States, being made on farms. Abbout two-thirds of the cheese is made in Wisconsin, and half of the remainder in New York. Cheese production has developed in those parts of Wisconsin and New York having less than 150 days in the growing season, except along the lake shores, and in the central, sandy portion of Wisconsin, which has poor pastures. The short, cool season favors summer pasture and cheese production, just as silage, winter dairying, butter making, skim milk, hogs, and corn complete the economic cycle in the warmer belt to the South."—United States Department of Agriculture Yearbook 1922, 1923 |
 |
Butter Made in Factories, 1921, 1921 A map showing butter production in factories by state in 1921. |
 |
Organized Protection Against Forest Fires, 1922 Map showing the funds dedicated to forest fire prevention compared to the funds needed to adequately protect forest land. |
 |
Cattle Tick Quarantine Area in the South, 1922 A map showing zones of quarantine for infestation with cattle ticks and areas released from this quarantine in the South in 1922. |
 |
Radio Crop and Market News Service, December 1, 1922 Map showing the radio broadcast coverage areas for crop and market news reports. |
| Maps > United States > Complete Maps |
Maps is a part of the Educational Technology Clearinghouse
Produced by the Florida Center for Instructional Technology © 2007
College of Education, University of South Florida